READ THE PATTERN • CHECK THE REASON
How to use a custom multiplication table
A multiplication table is a map of products. Find one factor on the left and the other along the top; their intersection gives the answer. A small, well-chosen table is often more useful than a crowded 100 × 100 grid. Start with a range you can explain, then use the settings to investigate one pattern at a time.
Choose settings for your goal
- Everyday times-table practice: choose start 1, end 12 and skip 1 in decimal. Use the 12 × 12 multiplication chart for a ready-made reference and blank practice version.
- A focused section: start 6 and end 9 gives factors 6, 7, 8 and 9 on both axes. It contains 16 product cells, not the complete 6, 7, 8 and 9 times tables from ×1 onward.
- Skip-counting: start 2, end 10 and skip 2 gives 2, 4, 6, 8, 10. Skip is the step between factor labels; it does not remove every second answer after multiplication.
- Number representations: keep the same factors and compare decimal, binary, hexadecimal and Roman labels. All settings are entered as ordinary decimal integers, regardless of display format.
- Appearance: select a theme or custom colours, border style, font, font size and padding. Choose dark text on a light cell background. Colour should support a pattern you can explain aloud.
Select a product cell by clicking or tapping it to read its equation. With the table focused, use arrow keys to move between product cells. The row/column hover option helps trace the factors with a pointer.
The range accepts whole numbers from 1 to 100. Zero, negative numbers and fractions are outside this tool’s input scope, although multiplication is defined for them. The start must be less than or equal to the end. With start s, end e and positive integer step k, the number of selected factors is floor((e − s) ÷ k) + 1. The resulting square table has that many rows and columns of products.
Orientation: horizontal uses row factor × column factor; vertical reverses the order in the displayed equations. Both axes use the same selected factors, so the products stay in the same places. Transposing this symmetric square grid leaves its values unchanged.
Six worked examples
1. Read the intersection: 4 × 6
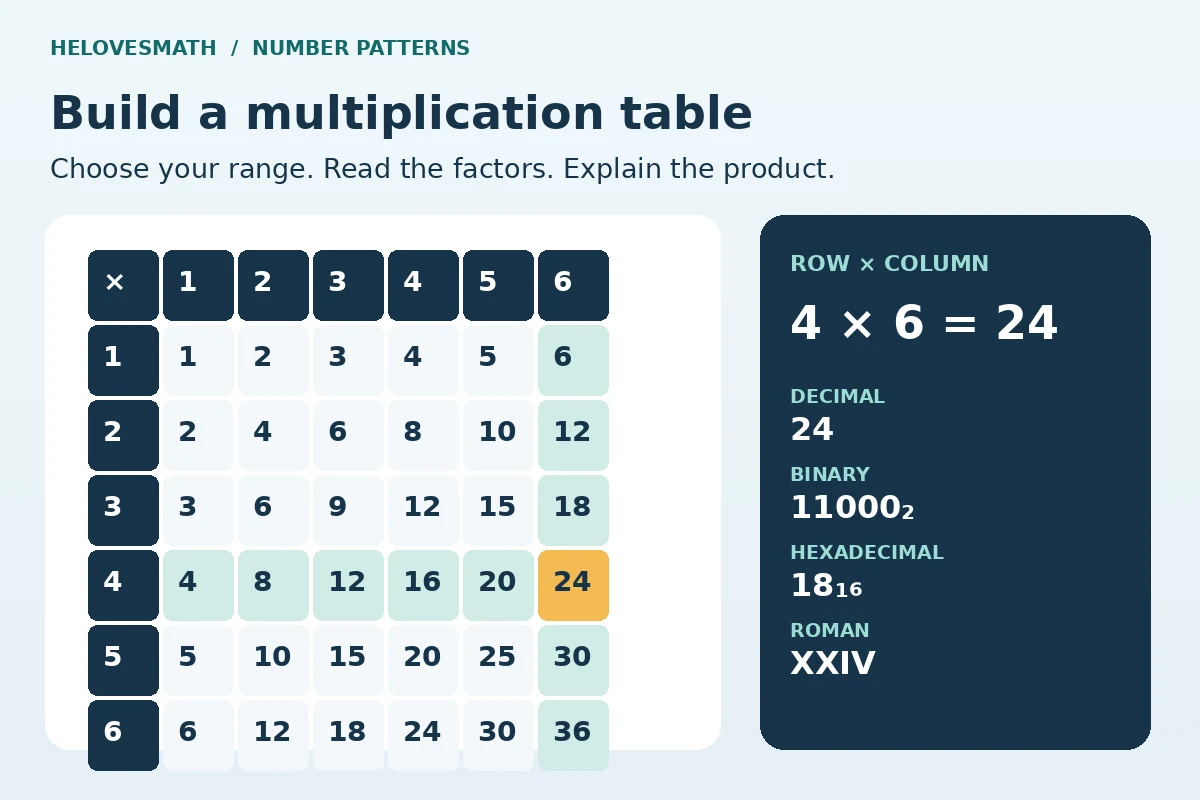
Use factors 1–6. Follow row 4 across to column 6: the product is 24. Four groups of six contain 6 + 6 + 6 + 6 = 24 objects. The symmetric cell, row 6 and column 4, also shows 24. These are two factor orders for the same product.
2. Derive 7 × 8 from facts you know
Split seven rows into five rows and two rows. The first part contains 5 × 8 = 40 objects and the second contains 2 × 8 = 16. Therefore 7 × 8 = 40 + 16 = 56. This is the distributive property: (5 + 2) × 8 = 5 × 8 + 2 × 8. The same approach works with a different split, such as 7 × (4 + 4).

3. Understand a skipped range
Set start 3, end 11 and skip 4. The labels are 3, 7, 11, because 3 + 4 = 7 and 7 + 4 = 11. There are floor((11 − 3) ÷ 4) + 1 = 3 labels and 3 × 3 = 9 product cells. Row 7, column 11 gives 77. With end 10 instead, the labels are only 3 and 7; the end value is included only if the steps reach it.
4. Recognise a square number
The main diagonal uses equal factors: 1 × 1, 2 × 2, 3 × 3 and so on. At row 9, column 9, 9² = 81. The difference from 8² = 64 is 17, because an 8 × 8 array becomes a 9 × 9 array by adding a strip of 8, a second strip of 8 and the corner square: 8 + 8 + 1 = 17.
5. Change notation without changing the answer
Decimal 4 × 6 = 24 becomes binary 100₂ × 110₂ = 11000₂. The result is 16 + 8 = 24 in decimal. In hexadecimal it is 4₁₆ × 6₁₆ = 18₁₆, where 18₁₆ means 1 × 16 + 8, not decimal eighteen. Roman notation gives IV × VI = XXIV. For longer conversions, use the numeral systems converter.

This generator uses the familiar unbarred Roman convention for 1–3999. Larger products remain available but are explicitly marked as decimal fallback. For example, 64 × 64 = 4096 is outside that Roman display convention; it is still an exact valid product.
6. Read a table backwards to divide
Find 72 in the row labelled 8. It lies under column 9, so 8 × 9 = 72 and 72 ÷ 8 = 9. The related fact 72 ÷ 9 = 8 follows from the same pair. Division reverses a multiplication relationship; swapping the operands of a division generally changes the answer.
Patterns worth investigating
Why are the two halves mirror images? Multiplication of whole numbers is commutative: a × b = b × a. A rectangular array can be read by rows or by columns. This symmetry halves much of the new recall work once a fact is secure, but each fact still needs meaning and practice.
Why are there no prime products in a table starting at 2? A prime number has exactly two positive divisors, 1 and itself. If both factors exceed 1, their product has a nontrivial factor and is composite. Prime products can therefore appear only in row 1 or column 1 of this positive-integer table, paired with a prime factor. The number 1 is neither prime nor composite. See the explanation of why 1 is not prime.
What does “Highlight Multiples of” mean? A multiple of 6 is divisible by 6 with no remainder. For example, 3 × 4 = 12 is highlighted even though neither factor is 6. Highlighting refers to the product. Where prime and multiple highlights overlap, the prime highlight takes priority; the gradient or alternating row colours provide the base layer.
Does a larger table teach more? A larger grid displays more facts, but it may be harder to read or use for focused recall. Start with a short range, hide the answer with a hand or paper, explain a strategy, then check. For further activities, use the multiplication learning and practice guide. In England, the Year 4 curriculum includes recall through 12 × 12; a custom table is a supporting resource, not a test of mastery by itself.
Try eight questions, then check your reasoning
Work without looking at the generated answers first. Use the table afterwards to check the factors and explain any correction.
1. What is 6 × 8? Use a known fact to explain.
48. Double 3 × 8 = 24, giving 6 × 8 = 48. Alternatively, 5 × 8 + 1 × 8 = 40 + 8.
2. Start 2, end 14, skip 3: which factors appear, and how many product cells?
2, 5, 8, 11, 14; 25 cells. There are five factors, so 5 × 5 = 25 intersections. The largest product is 14 × 14 = 196.
3. Start 4, end 11, skip 3: is 11 a label?
No. The labels are 4, 7 and 10; the next step is 13, beyond the end. There are nine product cells and the largest product is 10 × 10 = 100.
4. How does 8 × 7 help you find 7 × 8?
Both equal 56. Swapping the factors changes how the array is described, but not how many objects it contains.
5. Write 5 × 6 = 30 in binary and hexadecimal.
101₂ × 110₂ = 11110₂ and 5₁₆ × 6₁₆ = 1E₁₆. Binary 11110₂ is 16 + 8 + 4 + 2 = 30. Hexadecimal E represents decimal 14, so 1E₁₆ = 16 + 14 = 30.
6. In the 1–10 table, which cells have prime products?
Eight cells: (1,2), (1,3), (1,5), (1,7), (2,1), (3,1), (5,1), (7,1). There are four distinct prime values, each appearing twice. The (1,1) cell is not prime.
7. Does highlighting multiples of 4 colour the 6 × 6 cell?
Yes. Its product is 36 = 4 × 9. Neither factor needs to equal 4, and the factors do not both have to be multiples of 4.
8. A row contains 84 under column 7. What is its row label?
12. Solve the missing-factor statement □ × 7 = 84 using 84 ÷ 7 = 12. Check: 12 × 7 = 84.
Copy, print and save the table
Copy to Clipboard exports tab-separated values with a title and description, suitable for pasting into a spreadsheet or document. Clipboard access depends on the browser; an error should be reported rather than a false success. Copying does not publish or send the table anywhere.
Print Table prepares the current table for the browser’s print facility. If your browser offers “Save as PDF”, choose it there; there is no separate direct PDF button. Wide tables may need landscape orientation, smaller type or a narrower range. Inspect the preview before printing. Browser or organization policy may disable printing.
Save as Image creates a PNG of the table. Very wide tables can exceed a practical image size; use a shorter range or larger skip if the tool requests it. The preview and copied text remain available. Custom colours can become unreadable, so check the image before sharing it.
Changes to settings must be generated before they are treated as the finished table; export actions validate and use current settings. Reset restores defaults and the 1–10 grid. There is no saved-configuration history or dark-mode control in this tool.
Sources & References
These references support the curriculum, number-representation and factor terminology. The worked examples, questions and diagrams above are original to this guide.
- Department for Education: mathematics programmes of study — arrays, commutativity, derived facts and Year 4 multiplication expectations in England.
- Carnegie Mellon University: more about binary numbers — positional base-two notation and arithmetic.
- OpenStax Prealgebra 2e: find multiples and factors — factors, multiples, primes and composite numbers.