PERCENTAGES • BUSINESS MATHS
Profit margin: divide profit by revenue
Subtract the relevant costs, divide the resulting profit by revenue, then multiply by 100. Learn the three common margins, see why markup is different, and check your work with the calculator.
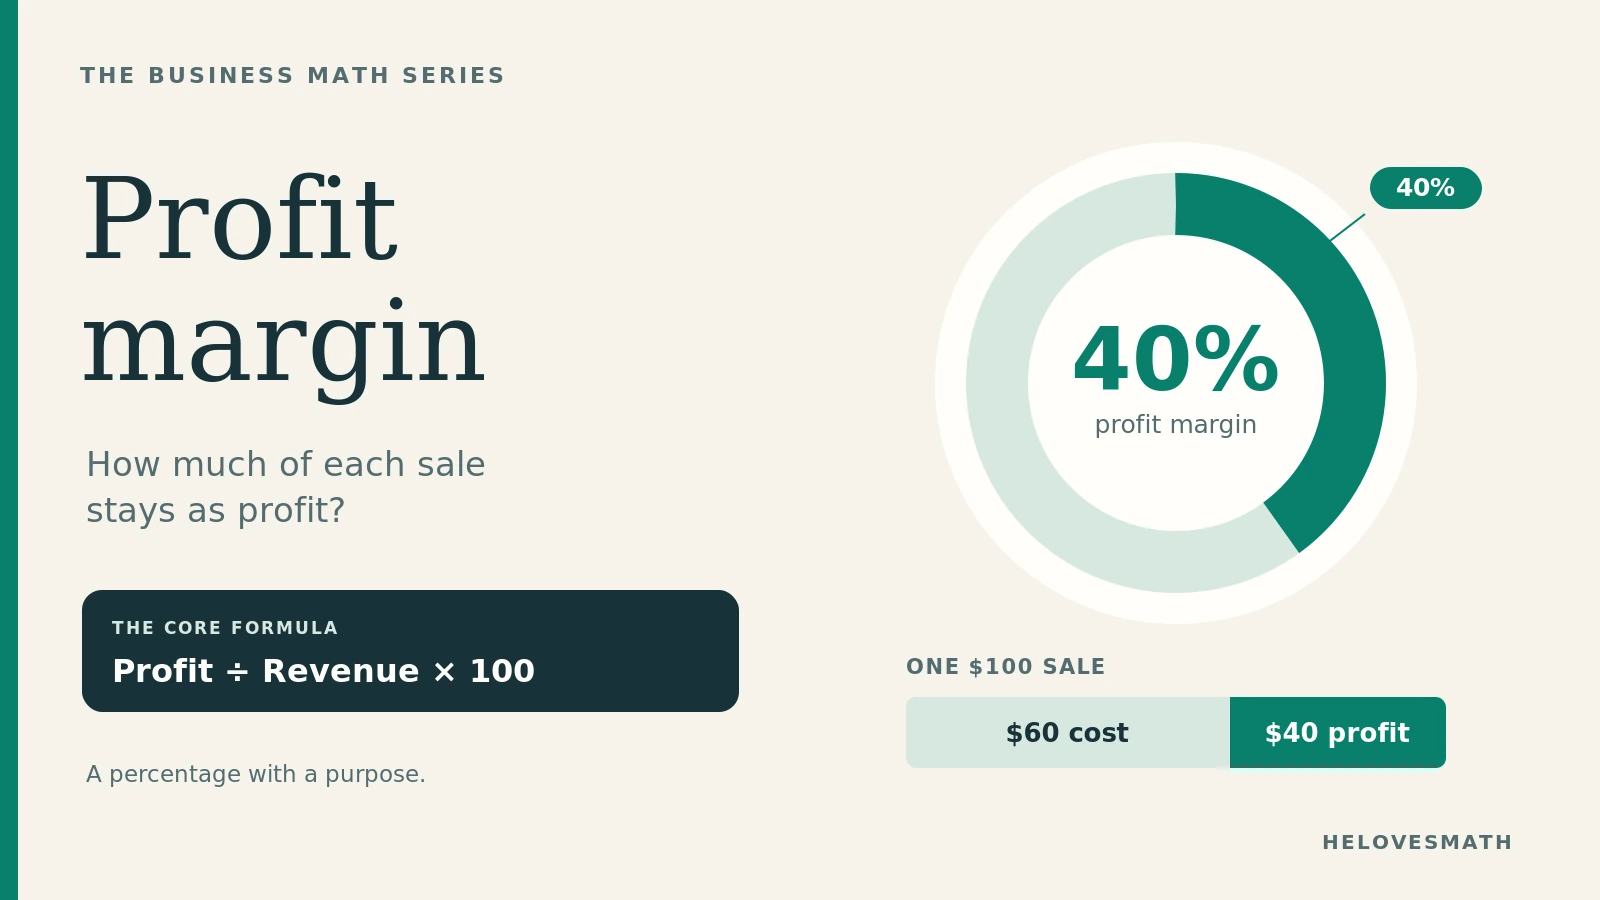
For example, $40 profit on $100 of revenue gives a 40% margin.
Educational guide and simplified calculator. It does not assess business health or replace accounting, tax or investment advice.
Interactive profit margin calculator
Enter revenue and costs for the same period and currency. The display uses dollars, but the percentage works identically for any one consistently used currency. Enter amounts without commas or currency symbols, with up to two decimal places. Each field accepts 0 to 1,000,000,000,000.00; revenue must be greater than zero.
What is profit margin? The three common types
A profit margin expresses a specified profit as a percentage of revenue. A 20% margin means $0.20 of that kind of profit per $1 of revenue. Always name the profit measure: a 20% gross margin and a 20% net margin describe different things.
1. Gross profit margin
Gross profit = revenue − cost of goods sold (COGS). COGS is the cost assigned to the goods sold during the period. It can include materials, direct labour and allocated production overhead. It is not necessarily just the cash paid for purchases that month. In a manufacturing business, qualifying factory overhead can enter inventory cost and later COGS.
2. Operating profit margin
In this guide's simplified income statement, operating profit = gross profit − operating expenses, such as selling and administrative expenses that are not already in COGS. Operating profit and EBIT (earnings before interest and taxes) are not universally interchangeable: definitions and non-operating items can differ. Use the named measure consistently.
3. Net profit margin
Net margin = net income ÷ revenue × 100. Net income includes the relevant revenues, expenses, gains, losses and taxes in the income statement. Our calculator subtracts taxes and interest from operating profit, so its net result is valid only for that simplified model.
The original loss example still illustrates the ratio: revenue of $5 million and total expenses of $5.1 million give a $100,000 loss. The net margin is −100,000 ÷ 5,000,000 × 100 = −2%.
The formulas, with a complete worked example
Let R be revenue, C be COGS, O be operating expenses and T be taxes plus interest. All amounts must cover the same period. For this four-input model:
Gross profit = R − C
Gross margin (%) = [(R − C) ÷ R] × 100
Operating profit = R − C − O
Operating margin (%) = [(R − C − O) ÷ R] × 100
Simplified net income = R − C − O − T
Simplified net margin (%) = [(R − C − O − T) ÷ R] × 100
The denominator stays R every time. Do not divide operating profit by gross profit or net income by operating profit when calculating these margins.
Example 1: the furniture company
A furniture company reports $1,000,000 revenue, $400,000 COGS, $350,000 operating expenses and $100,000 taxes plus interest, with no other income-statement items in this example.
- Gross profit: 1,000,000 − 400,000 = $600,000. Margin: 600,000 ÷ 1,000,000 × 100 = 60%
- Operating profit: 600,000 − 350,000 = $250,000. Margin: 250,000 ÷ 1,000,000 × 100 = 25%
- Simplified net income: 250,000 − 100,000 = $150,000. Margin: 150,000 ÷ 1,000,000 × 100 = 15%
The 15% net margin means 15 cents of accounting profit per dollar of revenue under these assumptions. It does not mean 15 cents of unrestricted cash.

Profit margin versus markup: change the denominator
For one item with selling price S and cost C, profit is S − C. Margin measures profit against the selling price; markup measures it against cost.
Margin (%) = [(S − C) ÷ S] × 100, with S > 0
Markup (%) = [(S − C) ÷ C] × 100, with C > 0

Example 2: a $50 widget
The original widget example is a useful check. A 50% markup on a $50 cost adds $25, so the selling price is $75. Its margin is 25 ÷ 75 × 100 = 33⅓%, not 50%. To obtain a 50% margin on that cost, sell for $100: profit is $50, margin is 50 ÷ 100 = 50%, and markup is 50 ÷ 50 = 100%.
Convert margin to markup
Use decimal rates, not whole percentage numbers: m = 0.40 means a 40% margin, and u = 0.6666… means a 66⅔% markup.
u = m ÷ (1 − m)
m = u ÷ (1 + u)
| Target margin | Equivalent markup |
|---|---|
| 10% | 11.1% |
| 20% | 25.0% |
| 30% | 42.9% |
| 40% | 66.7% |
| 50% | 100.0% |
| 75% | 300.0% |
Markup can exceed 100% without an upper limit. For example, cost $1 and selling price $1,000 give profit $999 and markup 99,900%; the margin is 99.9%. With zero cost and a positive selling price, margin is 100%, but markup is undefined because its denominator is zero.
How to calculate a profit margin, step by step
- Choose the period and scope. Compare a month with that month's costs, or a quarter such as Q2 with that quarter's costs. Keep a single-product calculation separate from the full company's income statement.
- Identify revenue on a consistent basis. Use revenue recognized for the period, normally after returns, allowances and applicable sales discounts. It is not necessarily the cash collected. Do not mix tax-inclusive sales with tax-exclusive costs without checking the accounting treatment.
- Find the relevant profit. Use gross profit, operating profit or net income from the same statement, or subtract the appropriate non-overlapping costs in the simplified model.
- Divide profit by revenue. Revenue must be nonzero; this lesson assumes positive revenue. Keep the sign if the result is a loss.
- Multiply by 100 and label the result. State the margin type, time period and rounding. Check by multiplying the unrounded margin rate by revenue to recover profit.
If your numbers are in a single currency, that unit cancels in the ratio: dollars ÷ dollars gives a dimensionless number. Currency mixing does not cancel correctly. A percentage is also different from a currency amount: $50,000 net income on $200,000 revenue is a 25% net margin.
More worked examples
Example 3: recover a selling price from a target margin
A product costs $60 and the target gross margin is 40%. Write m = 0.40. Starting with m = (S − C)/S, multiply by S: mS = S − C. Rearrange to S(1 − m) = C.
S = 60 ÷ (1 − 0.40) = 60 ÷ 0.60 = $100
Check: ($100 − $60) ÷ $100 = 0.40. For positive cost, the formula needs m < 1. A 100% margin is impossible at any finite selling price when cost is positive. A target gross margin does not include all the overhead needed to calculate net margin.
Example 4: round up when a minimum margin must be met
Cost is $19.99 and the required margin is at least 30%. The exact price is 19.99 ÷ 0.70 = $28.557142857… . At cent precision, choose $28.56. Its margin is 8.57 ÷ 28.56 × 100 ≈ 30.0070%. At $28.55, the margin is about 29.9825%, below the target. Round the required price up to the next available cent, not down; then recheck the achieved margin.
Example 5: a negative margin can be below −100%
Revenue is $200 and total relevant costs are $500. Profit = 200 − 500 = −$300. Margin = −300 ÷ 200 × 100 = −150%. The loss is one and a half times revenue. A negative result is meaningful and should not be forced to zero.
Example 6: combine margins using revenue weights
Item group A has revenue $100 and profit $40 (40% margin). Group B has revenue $900 and profit $90 (10% margin). Combined profit is $130 on $1,000 revenue, so the combined margin is 13%. The ordinary average, (40% + 10%)/2 = 25%, is wrong because the revenue weights differ.
Equivalent weighted calculation: (100/1,000) × 40% + (900/1,000) × 10% = 13%. Compare or combine the same kind of margin for compatible periods and accounting definitions.
What is a good profit margin?
There is no universal pass mark. The old claim that 5% is always low, 10% always healthy and 20% always strong is too broad. Industry, business model, accounting policies, economic conditions and company stage affect the comparison.
Start by identifying whether a benchmark is gross, operating or net, the period it covers and which businesses it includes. Compare like with like and examine changes over time. A supermarket's net margin and a luxury retailer's gross margin cannot be compared as if they measured the same thing.
What profit margin can and cannot tell you
Margins put profit on a revenue-relative scale, making it easier to examine a business over time or compare similar operations. Absolute profit still matters: a small business and a large business can have the same margin and very different profit amounts.
- A falling gross margin may prompt questions about pricing, product mix or COGS, but the ratio alone does not identify the cause.
- A gap between gross and operating margin shows the effect of operating expenses in the simplified model.
- A gap between operating and net margin may reflect interest, taxes and other non-operating items.
- A high margin alone does not prove efficiency, sufficient cash, solvency or fair valuation. A business with zero current profit is not automatically worthless.
Cost-change example: revenue is $100, costs are $98 and profit is $2 (2% margin). If all costs rise by 3% while revenue stays fixed, costs become 98 × 1.03 = $100.94 and profit becomes −$0.94 (−0.94% margin). This arithmetic describes a loss, not an automatic bankruptcy event. If only one cost category changes, apply the increase to that category.
Common mistakes to avoid
- Dividing by cost. That gives markup, not margin.
- Typing 40 in place of 0.40. In the target-price formula use a decimal rate.
- Treating blanks as known facts. The calculator's blank operating-expense and tax/interest fields assume zero; that does not establish your net profit.
- Double-counting an expense. Do not subtract a production cost again as operating overhead if it is already in COGS.
- Ignoring returns or mixing periods. Align revenue, profit and costs to the same basis.
- Averaging percentages equally. For combined margin, add profit and revenue first, or use revenue weights.
- Rounding intermediate values too soon. Keep exact amounts through the calculation and round the display at the end.
- Claiming every margin is capped at 100%. That cap follows from P = R − C with R > 0 and C ≥ 0. A reported net-income ratio can behave differently when other gains or credits are included.
Seven ways to investigate a change in margin
These are questions for analysing the numbers, not guaranteed business recommendations. A change that improves one ratio can still harm sales, quality or cash flow.
- Price: model a different selling price and the possible change in sales volume; do not assume demand stays fixed.
- Product mix: calculate revenue-weighted margins across products rather than assuming a fixed 80/20 rule.
- Input costs: isolate supplier, material, freight and production changes while keeping cost classifications consistent.
- Bundles and discounts: calculate the combined revenue and combined costs; a discount can reduce profit even if revenue rises.
- Operating expenses: check whether recurring costs changed and whether any expense has been counted twice.
- Interest and tax: distinguish changes in operating performance from financing and tax effects; a financing decision requires a separate assessment of costs and risks.
- Process changes: include implementation costs, ongoing costs and realistic output assumptions before interpreting any projected gain.
Practice: calculate, then check
Use the stated simplified assumptions. Round only the final percentage where requested.
1. Revenue is $250 and COGS is $175. Find gross profit and margin.
Profit = 250 − 175 = $75. Margin = 75 ÷ 250 × 100 = 30%.
2. An item costs $80 and sells for $100. Find margin and markup.
Profit = $20. Margin = 20/100 × 100 = 20%; markup = 20/80 × 100 = 25%.
3. Revenue is $2,000, COGS $1,200, operating expenses $500, and taxes plus interest $100. Find all three margins.
Gross profit $800 gives 40%. Operating profit $300 gives 15%. Simplified net income $200 gives 10%. Every denominator is $2,000.
4. An item costs $84. What selling price gives a 30% margin?
S = 84/(1 − 0.30) = $120. Check: profit $36 divided by $120 = 30%.
5. Revenue is $150 and relevant costs total $180. Find the margin.
Profit is −$30. Margin = −30/150 × 100 = −20%.
6. Cost is $0 and selling price is $45. Find margin and markup.
Profit is $45, so margin is 100%. Markup is undefined, because its denominator would be zero.
7. Group A has revenue $200 and profit $80; group B has revenue $800 and profit $80. Find the combined margin.
Total profit $160 divided by total revenue $1,000 gives 16%. The unweighted average of 40% and 10% would be wrong.
8. A margin rises from 12% to 15%. State the percentage-point and relative percentage increases.
The rise is 3 percentage points. Relative increase = (15 − 12)/12 × 100 = 25%.
Frequently asked questions
How do I calculate profit margin?
Divide the relevant profit by revenue and multiply by 100. State whether you used gross profit, operating profit or net income.
How is markup different from margin?
Markup divides profit by cost; margin divides it by selling price or revenue. A 100% markup on positive cost gives a 50% margin.
What is a good or healthy margin?
There is no universal percentage. Use comparable businesses, matching margin definitions and the same reporting period. Margin alone does not establish financial health.
How can a margin increase?
In the simple model it rises when costs fall relative to revenue. Changes to price, volume, costs or product mix must be analysed together; there is no guaranteed strategy.
Why can gross margin be positive while net margin is negative?
COGS may be covered by revenue while operating and other expenses exceed gross profit. That is possible without assuming that any single expense or person is to blame.
Can a profit margin exceed 100%?
In P = R − C with positive revenue and nonnegative costs, no: P ≤ R. In reported accounts, other income, gains or credits may make net income exceed the particular revenue denominator. Always inspect the definition.
Is profit margin the same as net income?
No. Net income is a currency amount. Net profit margin is that amount divided by revenue, expressed as a percentage.
Why does the calculator reject zero revenue or negative expenses?
A zero revenue denominator is undefined. Negative expenses and credits require a broader accounting model than this nonnegative-cost calculator. Losses remain allowed when costs exceed positive revenue.
Why did my results disappear after editing a number?
The old result is cleared so it cannot be mistaken for an answer to the new inputs. Select Calculate Profit Margins again, or press Enter in an input.
Related maths tools
Use the scientific calculator to check percentage arithmetic, or the price and markup calculator for a related pricing model. Return to the HeLovesMath directory.
Sources & References
The explanation uses standard percentage algebra. These primary references support the accounting distinctions; examples and diagrams are original educational illustrations.
- U.S. SEC: Beginners’ Guide to Financial Statements. Income statements, profit measures and the distinction between profit and cash flow.
- IFRS Foundation: IAS 2 Inventories. Inventory costs include conversion costs and production overhead; recognition of inventory expense.
- U.S. SEC: Non-GAAP Financial Measures, questions 103.01–103.02. Why EBIT and operating income should not automatically be treated as identical.
- Mississippi State University Extension: Product Pricing and the Breakeven Concept. Markup bases, pricing calculations and break-even context.
Reviewed 5 October 2026. Worked examples use the assumptions stated beside them.