KS3 • GCSE revision • probability practice
Choose from 45 probability worksheet sets, with links to editable Word files, question PDFs and 44 separate answer PDFs from Dr Austin Maths. Start with a topic below, or use our worked examples and 12 original practice questions before downloading a sheet.
The original publisher hosts the downloads. This is a selected collection, not every resource currently available. The experiment activity records pupils’ own results, so results vary and no separate answer link is listed.
Which probability worksheet should I choose?
Start with one event
Practise fair dice, equal-section spinners and random selections. Then compare theoretical probability with experimental relative frequency.
Choose basic probability practiceOrganise a sample space
Use set notation, Venn diagrams and two-way tables to count the correct outcomes. Check that each outcome is counted once.
Choose sets and Venn practiceCombine two events
List ordered outcomes or use a probability tree. Decide whether the second probability changes after the first event.
Choose sample spaces and treesLevel guide: England’s KS3 curriculum includes probability scales, experiments, sets and equally likely sample spaces. GCSE develops independent and dependent combined events, including tree diagrams. AQA’s current specification includes independent and dependent tree-diagram problems within Foundation content; explicit conditional-probability interpretation is Higher-only. These are topic guides, not a claim that every question in a linked worksheet suits every tier. Check your own exam-board specification and teacher’s advice.
Need the notation first? Use our maths-symbol reference. For the algebra in harder probability problems, try GCSE algebra practice.
The probability rules you actually need
- For equally likely outcomes: P(event) = favourable outcomes ÷ total possible outcomes. Count outcomes, not just the names of categories.
- Complement: P(not A) = 1 − P(A). Every probability lies between 0 and 1 inclusive.
- Experimental estimate: relative frequency = event count ÷ number of trials. It estimates probability; it does not guarantee the next result.
- “And” along a tree: multiply the probabilities on that path. Use the probability of the second event given the first; only use unchanged probabilities when independence is justified.
- “Or” across distinct paths: add probabilities of mutually exclusive paths. If events overlap, P(A or B) = P(A) + P(B) − P(A and B).
Six worked probability examples
1. A fair die: use equally likely outcomes
A fair six-sided die is numbered 1 to 6. What is the probability of rolling a number greater than 4?
Favourable outcomes: {5, 6}
P(greater than 4) = 2/6 = 1/3
P(not greater than 4) = 1 − 1/3 = 2/3
There are two categories, “greater than 4” and “not greater than 4”, but they are not equally likely. The six individual faces are equally likely.
2. Experimental probability: estimate, then predict
A drawing pin lands point-up 27 times in 60 trials. Using these results, estimate how many point-up outcomes to expect in another 200 trials under similar conditions.
Estimated probability = 27/60 = 0.45
Expected number = 200 × 0.45 = 90
90 is an expectation, not a promise. A new set of trials can give a different count. More well-conducted trials usually make the estimate more informative, but the relative frequency need not move closer to the true probability after every trial.
3. A Venn diagram: put the overlap in first
In a group of 30 students, 18 play football, 12 play tennis and 5 play both. One student is chosen at random, with each student equally likely to be chosen.
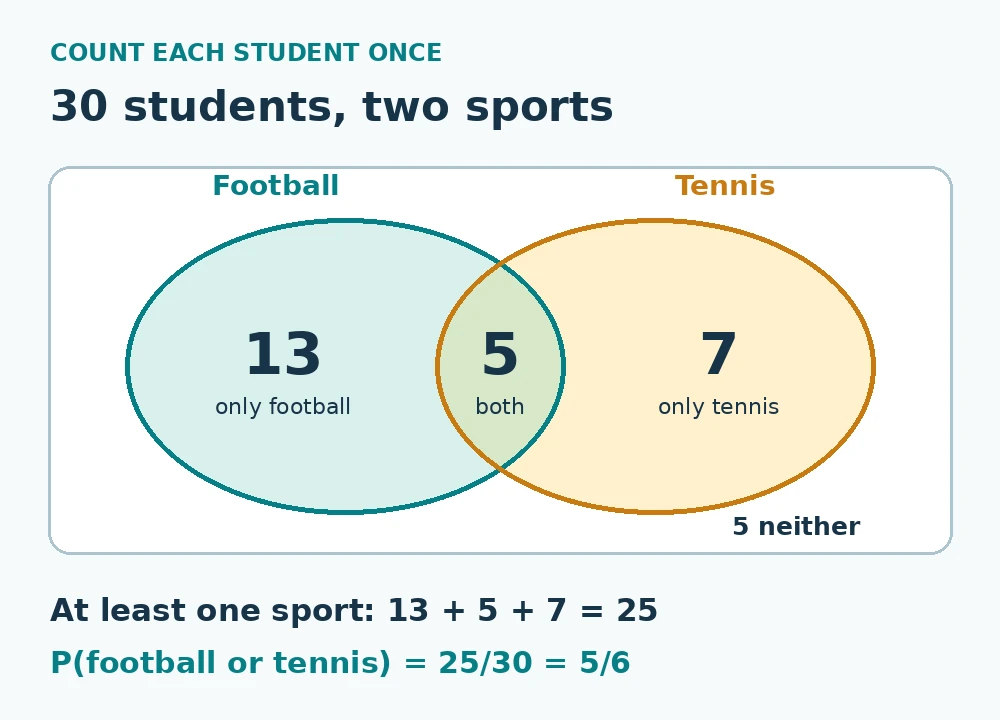
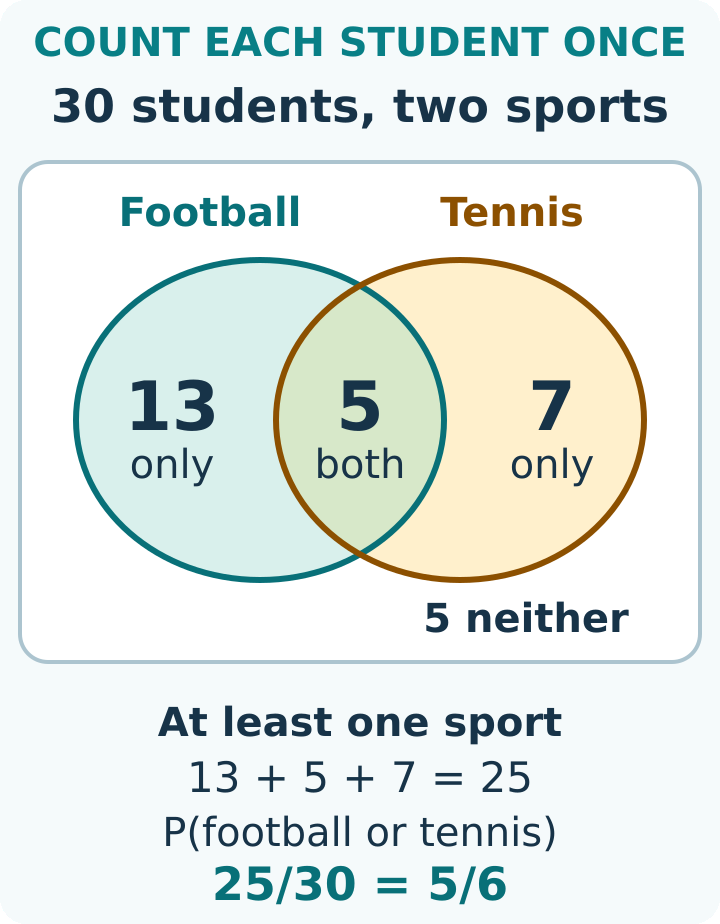
Football only = 18 − 5 = 13
Tennis only = 12 − 5 = 7
At least one sport = 13 + 5 + 7 = 25
Neither sport = 30 − 25 = 5
So P(football or tennis) = 25/30 = 5/6 and P(neither) = 5/30 = 1/6. In this context, “or” includes students who play both. Adding 18 + 12 without subtracting 5 counts the overlap twice.
4. Two dice: sums are not equally likely
Roll two fair, independent six-sided dice. There are 6 × 6 = 36 equally likely ordered pairs. The six pairs giving a total of 7 are (1,6), (2,5), (3,4), (4,3), (5,2) and (6,1).
P(total of 7) = 6/36 = 1/6
There are 11 possible totals, from 2 to 12, but a total of 2 has just one pair, (1,1). Dividing by 11 would wrongly assume that all totals are equally likely.
5. A tree without replacement: change the second branch
A bag contains 3 red counters and 2 blue counters. Draw two counters at random without replacement. What is the probability of getting one of each colour?
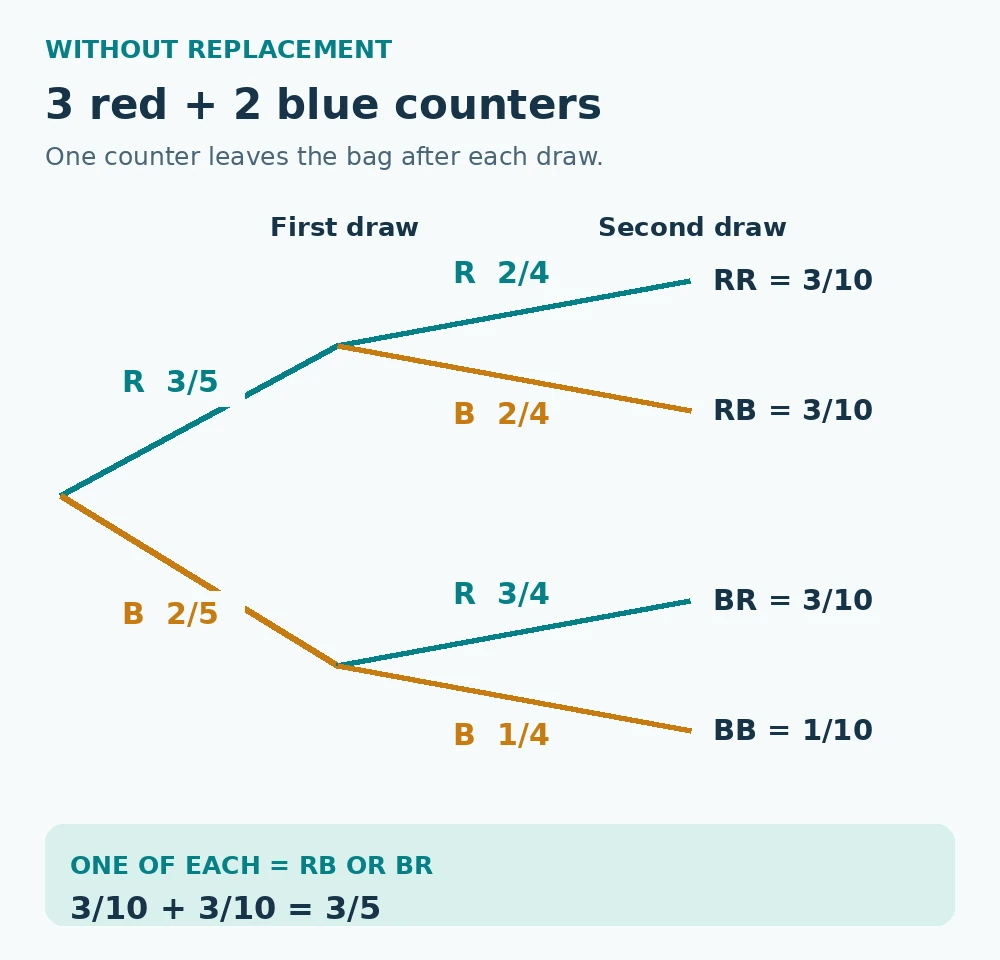
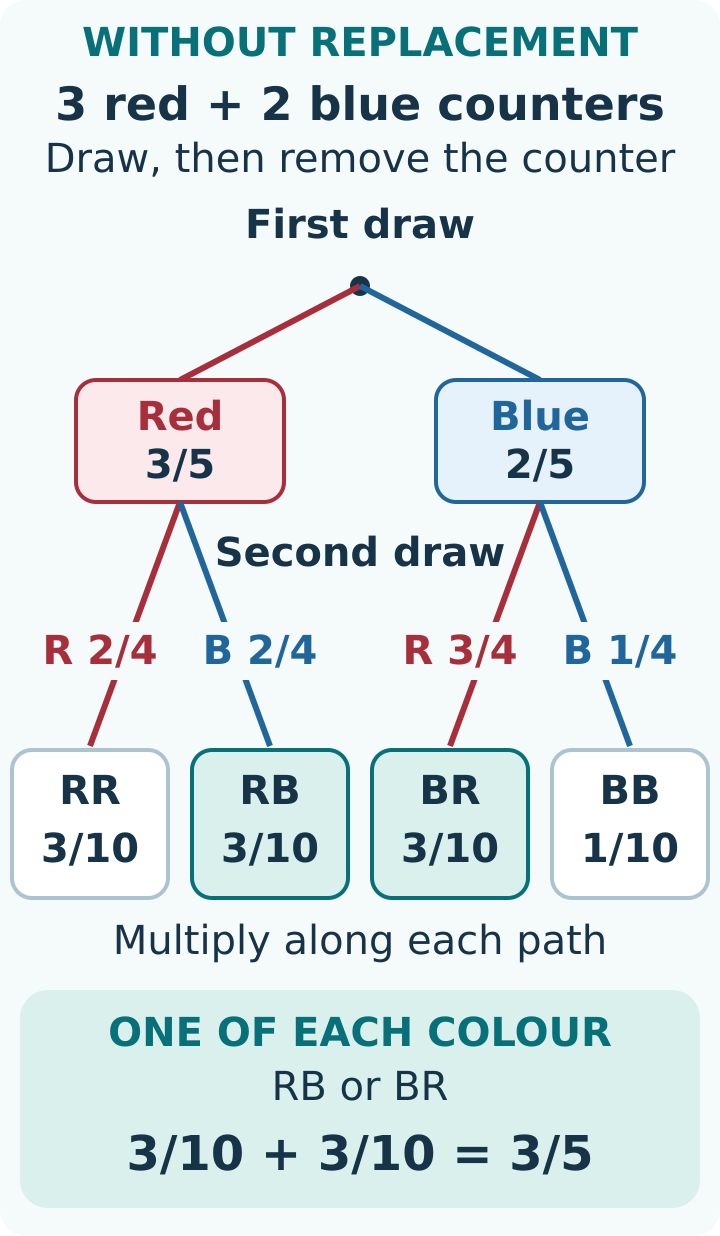
P(red then blue) = (3/5) × (2/4) = 3/10
P(blue then red) = (2/5) × (3/4) = 3/10
P(one of each) = 3/10 + 3/10 = 3/5
After one counter is removed, 4 remain. With replacement and a fresh random draw, the second probabilities would remain 3/5 and 2/5, giving P(one of each) = 12/25 instead. “Without replacement” changes the model.
6. Conditional probability: change the group you count
Return to the 30 students in Example 3. You are told the selected student plays football. What is the probability that they also play tennis?
P(tennis given football) = 5/18
The condition restricts the possible students to the 18 football players, of whom 5 also play tennis. The denominator is 18, not 30. The reverse condition gives P(football given tennis) = 5/12, a different question.
Common mistakes to catch before checking the answers
- Using 1/2 because there are two possibilities. Rain/no rain or win/lose need not be equally likely. A fair coin model is a specific assumption.
- Adding every time you see “or”. First check for overlap. Mutually exclusive events cannot happen together; independent events can, and neither changes the probability of the other.
- Forgetting the other order. One red and one blue includes RB and BR unless an order is specified.
- Keeping the old denominator after a draw. Without replacement, update both the number remaining and the relevant colour count.
- Treating an expected count as an actual count. An expected value can be non-integer, even though an observed count must be a whole number.
12 original probability practice questions
Try these before opening the worked answers. Use simplified fractions unless the question asks for an estimate or expected number. These questions and solutions are original HeLovesMath practice, separate from the publisher’s worksheet downloads.
- A fair die is numbered 1 to 6. Find P(a multiple of 3).
- A bag has 4 green counters and 6 yellow counters. One counter is selected at random. Find P(not green).
- An unbiased spinner has 8 equal sections, 3 coloured red. Find P(red) and the expected number of reds in 80 independent spins.
- A coin lands heads 18 times in 50 trials. Use the relative frequency to predict the number of heads in 150 more trials under the same conditions.
- Let U = {1, 2, 3, 4, 5, 6}, A = {2, 4, 6}, B = {4, 5, 6}. List A ∩ B, A ∪ B and A′ (the complement relative to U).
- Of 40 students, 22 like art, 17 like music and 8 like both. How many like neither? If a student is chosen at random, find P(art or music).
- Roll two fair, independent dice numbered 1 to 6. Find P(a total of 5).
- Toss a fair coin twice, independently. Find P(exactly one head).
- A bag contains 3 red and 2 blue counters. Two counters are drawn randomly without replacement. Find P(both red).
- Repeat Question 9, replacing the first counter and mixing before the second random draw. Find P(both red).
- For the students in Question 6, find P(music given art).
- Events A and B have P(A) = 0.4, P(B) = 0.3 and P(A and B) = 0.1. Find P(A or B). Are A and B mutually exclusive? Are they independent?
Show all 12 worked answers
- 1/3. Multiples of 3 are 3 and 6: 2/6 = 1/3.
- 3/5. “Not green” means yellow: 6/10 = 3/5. Equivalently, 1 − 4/10 = 6/10.
- 3/8; expected count 30. Probability = 3/8 and 80 × 3/8 = 30. The actual count can differ.
- 54 heads. Relative frequency = 18/50 = 0.36; 150 × 0.36 = 54. This is an estimate, not an assertion that the coin is fair.
- A ∩ B = {4, 6}; A ∪ B = {2, 4, 5, 6}; A′ = {1, 3, 5}. Intersection means in both; union means in either or both; complement means in U but not in A.
- 9 students; 31/40. Art only = 22 − 8 = 14; music only = 17 − 8 = 9. At least one = 14 + 8 + 9 = 31, so neither = 40 − 31 = 9.
- 1/9. The four favourable ordered pairs are (1,4), (2,3), (3,2), (4,1); 4/36 = 1/9.
- 1/2. The equally likely outcomes are HH, HT, TH, TT. Exactly one head occurs in HT or TH: 2/4 = 1/2.
- 3/10. P(RR) = (3/5) × (2/4) = 6/20 = 3/10.
- 9/25. Replacement restores the original composition: P(RR) = (3/5) × (3/5) = 9/25.
- 4/11. Restrict the group to the 22 art students; 8 also like music. Thus 8/22 = 4/11.
- 0.6; neither mutually exclusive nor independent. P(A or B) = 0.4 + 0.3 − 0.1 = 0.6. The intersection is not zero, so they are not mutually exclusive. Independence would require 0.4 × 0.3 = 0.12, which differs from 0.1.
Use the worksheets for a focused revision session
- Choose one skill you can name, such as “update a tree after a draw without replacement”.
- Study one worked example, then attempt a short strip without looking at the answer sheet.
- Mark the method as well as the final fraction. Write why an error happened: wrong sample space, double-counted overlap or unchanged denominator.
- Reattempt one missed question later, followed by a question in a different context.
When you are ready for a mixed assessment, see the Year 9 maths test collection. Match the paper and difficulty to the topics you have studied.
Questions about the worksheets
Are answers included?
The collection retains 44 separate links labelled Answers for 45 worksheet sets. Estimating Probability Experiments Activity has Word and PDF links only; pupils record their own experimental results. Our 12 original questions above have worked answers on this page. All 134 retained file links returned successful PDF or Word responses when checked on 3 October 2026. Three sampled question-and-answer pairs were reviewed; this is not a mathematical audit of every question in the collection.
Are the worksheets printable and editable?
Each listed set has a question-PDF link and an editable Word link hosted by Dr Austin Maths. Open the PDF for printing or the Word document for editing, subject to the publisher’s terms. Files and access can change; the publisher’s current collection is linked below.
Are these official GCSE exam papers?
No. These are practice resources from Dr Austin Maths plus original HeLovesMath explanations and questions. They are not official exam papers or a guarantee of coverage for a particular board or tier.
Sources & References
Worksheet publisher and curriculum references
Worksheet credit: The 45 sets below are by Dr Austin Maths. They remain hosted by the original publisher; HeLovesMath has not rehosted the files. This directory preserves the existing selection and links. The publisher may update titles and versions, so use its current collection for the latest resources.
- Dr Austin Maths: current probability collection
- Dr Austin Maths: resource formats and publisher information
- Department for Education: mathematics programmes of study
- AQA GCSE Mathematics 8300: probability content and tiers
Set Notation and Venns: 17 worksheet sets
Set Notation Practice Strips
This retained file is now labelled “Sets Described in Words Practice Strips” in the publisher’s current collection.
Set Notation True or False
Basic Set Notation Fill In The Blanks
Two Set Venn Diagrams Practice Strips
Venn Diagrams and Set Notation Fill In The Blanks
Set Notation and Venn Diagrams Practice Grid
Set Notation and Venn Diagrams Match-Up
Shading Two Set Venn Diagrams Practice Grid
Two Set Practical Problems Practice Strips
Harder Two Set Practical Problems Practice Strips
Three Set Venn Diagrams Practice Strips
Shading Three Set Venn Diagrams Practice Grid
Three Set Practical Problems Practice Strips
Venn Diagrams with Algebra Practice Grid
Probability and Two Set Venns Practice Strips
Probability and Three Set Venns Practice Strips
Sets and Venns Revision Practice Grid
Theoretical and Experimental Probability: 13 worksheet sets
Theoretical Probability with Dice Practice Grid
Theoretical Probability with Spinners Practice Grid
Theoretical Probability with Counters Practice Grid
Theoretical Probability with Playing Cards Practice Grid
Theoretical Probability Practice Strips
Theoretical Probability Odd One Out
Constructing Two-Way Tables Practice Grid
Completing Two-Way Tables Practice Grid
Finding Probability from Two-Way Tables Practice Grid
Two-Way Tables and Probability Practice Strips
Experimental Probability Practice Strips
Estimating Probability Experiments Activity
Record your own results; no separate answer file is listed. In the drawing-pin task, use one consistent outcome (point-up or point-down) when recording and calculating relative frequency.