Standard deviation is a crucial statistical tool that measures the spread or variability of a set of numbers. It helps us understand how much the values in a data set deviate from the mean (average). In this detailed guide, we’ll walk you through what standard deviation is, why it’s important, how to calculate it manually, and how to use tools like Excel to make the process easier.
What is Standard Deviation?
Standard deviation quantifies the variation or dispersion of a set of data points. A low standard deviation means that the data points tend to be close to the mean, while a high standard deviation indicates that the data points are spread out over a large range of values.
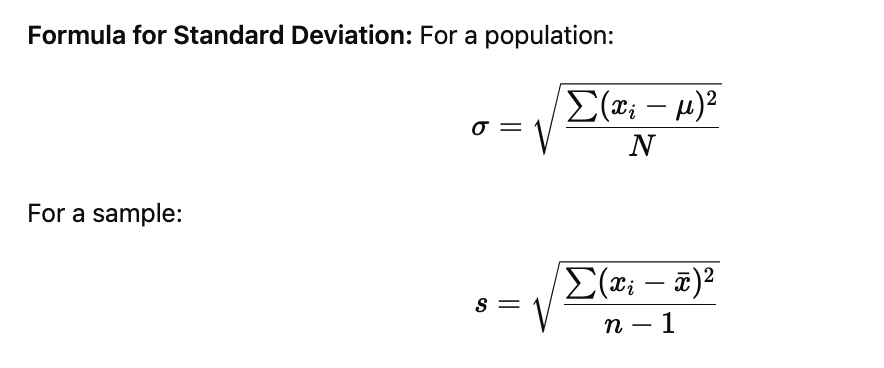
Where:
- σ\sigma = standard deviation for a population
- ss = standard deviation for a sample
- xix_i = each data point in the set
- μ\mu = population mean
- xˉ\bar{x} = sample mean
- NN = total number of data points in the population
- nn = total number of data points in the sample
Why is Standard Deviation Important?
Standard deviation gives us a sense of how spread out the data points are. It is commonly used in fields such as finance, research, engineering, and social sciences to evaluate the reliability of data sets, assess risk, and understand variability.
For example:
- In finance: A high standard deviation in stock returns indicates high volatility.
- In research: Standard deviation helps in determining the consistency of data and the reliability of experiments.
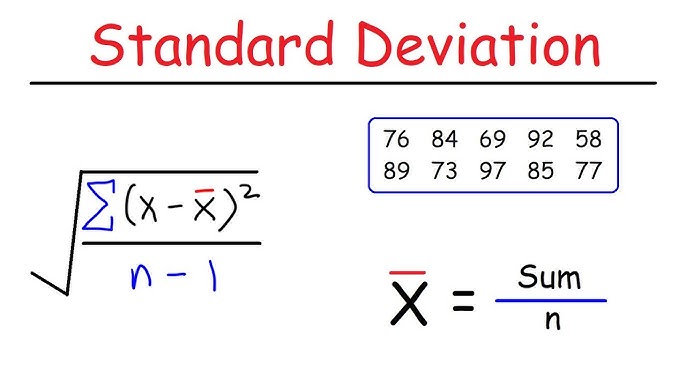
Step-by-Step Guide to Calculate Standard Deviation
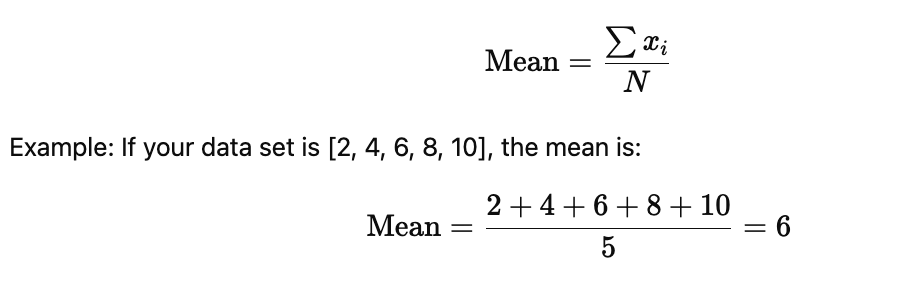
1. Find the Mean
The first step in calculating the standard deviation is finding the mean (average) of the data set.
2. Subtract the Mean from Each Data Point
For each data point, subtract the mean to find the deviation from the mean.
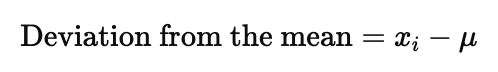
Using the previous example:
- 2−6=−42 – 6 = -4
- 4−6=−24 – 6 = -2
- 6−6=06 – 6 = 0
- 8−6=28 – 6 = 2
- 10−6=410 – 6 = 4
3. Square Each Deviation
Square the deviation to eliminate negative numbers and calculate the squared differences:
- (−4)2=16(-4)^2 = 16
- (−2)2=4(-2)^2 = 4
- 02=00^2 = 0
- 22=42^2 = 4
- 42=164^2 = 16
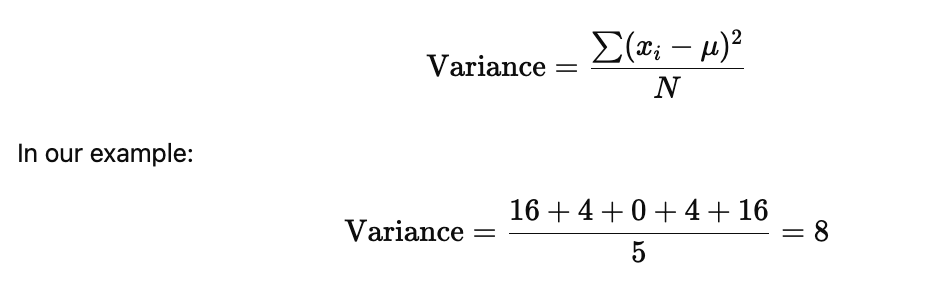
4. Calculate the Mean of Squared Deviations
For a population, divide the sum of the squared deviations by the number of data points (N). For a sample, divide by (n−1).
5. Take the Square Root
Finally, take the square root of the variance to get the standard deviation.
Standard Deviation=8≈2.83
How to Calculate Standard Deviation in Excel
Excel makes it easy to calculate standard deviation with built-in functions:
- For a sample: Use
=STDEV.S(data_range) - For a population: Use
=STDEV.P(data_range)
Simply input your data into a column, use the corresponding formula, and Excel will calculate the standard deviation for you.
Frequently Asked Questions (FAQs) About Standard Deviation
1. What is the difference between variance and standard deviation? Variance is the average of the squared differences from the mean, while standard deviation is the square root of the variance. Standard deviation is often more useful because it is in the same units as the original data, making it easier to interpret.
2. When should I use standard deviation instead of variance? Standard deviation is generally preferred when you need to interpret the spread of data in the same units as the data points. Variance is useful when dealing with statistical models or when further statistical analysis is required.
3. What is the difference between population and sample standard deviation? Population standard deviation considers every data point in the population, while sample standard deviation applies to a subset of data and uses n−1n-1 to account for the sample’s smaller size.
4. Can standard deviation be negative? No, standard deviation cannot be negative because it is a measure of the distance from the mean and is derived from squared differences, which are always positive or zero.
5. What does a high standard deviation indicate? A high standard deviation indicates that data points are widely spread from the mean, signifying higher variability.
6. How do you interpret a standard deviation in terms of data distribution? In a normal distribution, approximately 68% of data falls within one standard deviation of the mean, and 95% falls within two standard deviations.
7. Why is standard deviation important in finance? Standard deviation is used in finance to measure the risk or volatility of an asset. Higher standard deviations mean higher risk or potential for large price swings.
8. What are some common errors when calculating standard deviation? Common errors include forgetting to square the deviations from the mean, using the wrong formula for population or sample standard deviation, or calculating the mean incorrectly.
9. How do I know if my data set has high or low variability? If the standard deviation is large compared to the mean, the data set has high variability. Conversely, a small standard deviation indicates low variability.
10. Can standard deviation be zero? Yes, standard deviation can be zero if all data points are identical, meaning there is no variability in the data set.
Conclusion
Standard deviation is a powerful statistical tool that gives insight into the variability of data. Whether you are analyzing test scores, stock prices, or scientific data, understanding how to calculate and interpret standard deviation can enhance your analytical skills. Whether you calculate it manually or use software like Excel, mastering standard deviation is essential for data analysis.