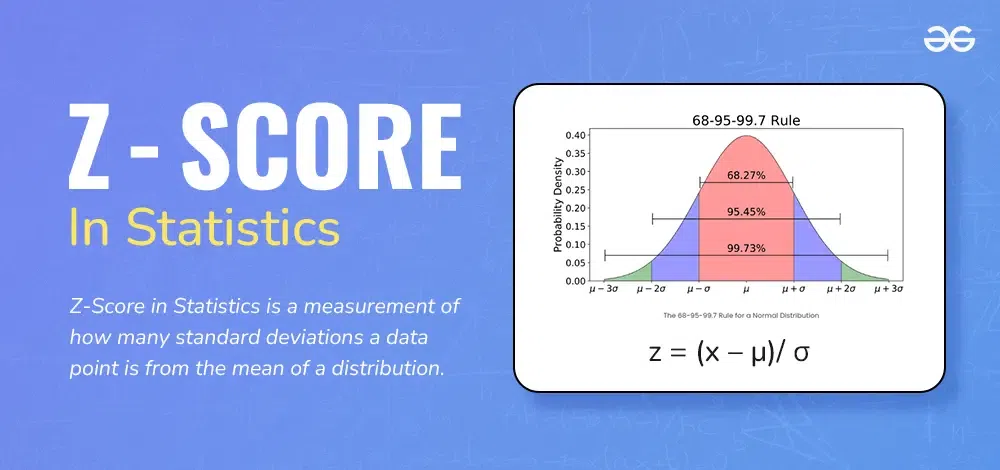
Z score is a statistical measure that indicates how many standard deviations a data point is from the mean of a data set. It is a useful tool for understanding the relative position of data points within a distribution. Whether you are analyzing test scores, financial data, or any other dataset, learning how to calculate a Z score can help you make informed comparisons and interpretations. In this blog post, we will explore how to calculate Z scores, why they are important, and answer some frequently asked questions about Z scores.
What is a Z Score?
A Z score, also known as a standard score, tells you how far away a particular data point is from the mean of a data set, measured in terms of standard deviations. A positive Z score indicates that the data point is above the mean, while a negative Z score indicates that the data point is below the mean.
Step-by-Step Guide to Calculate Z Score
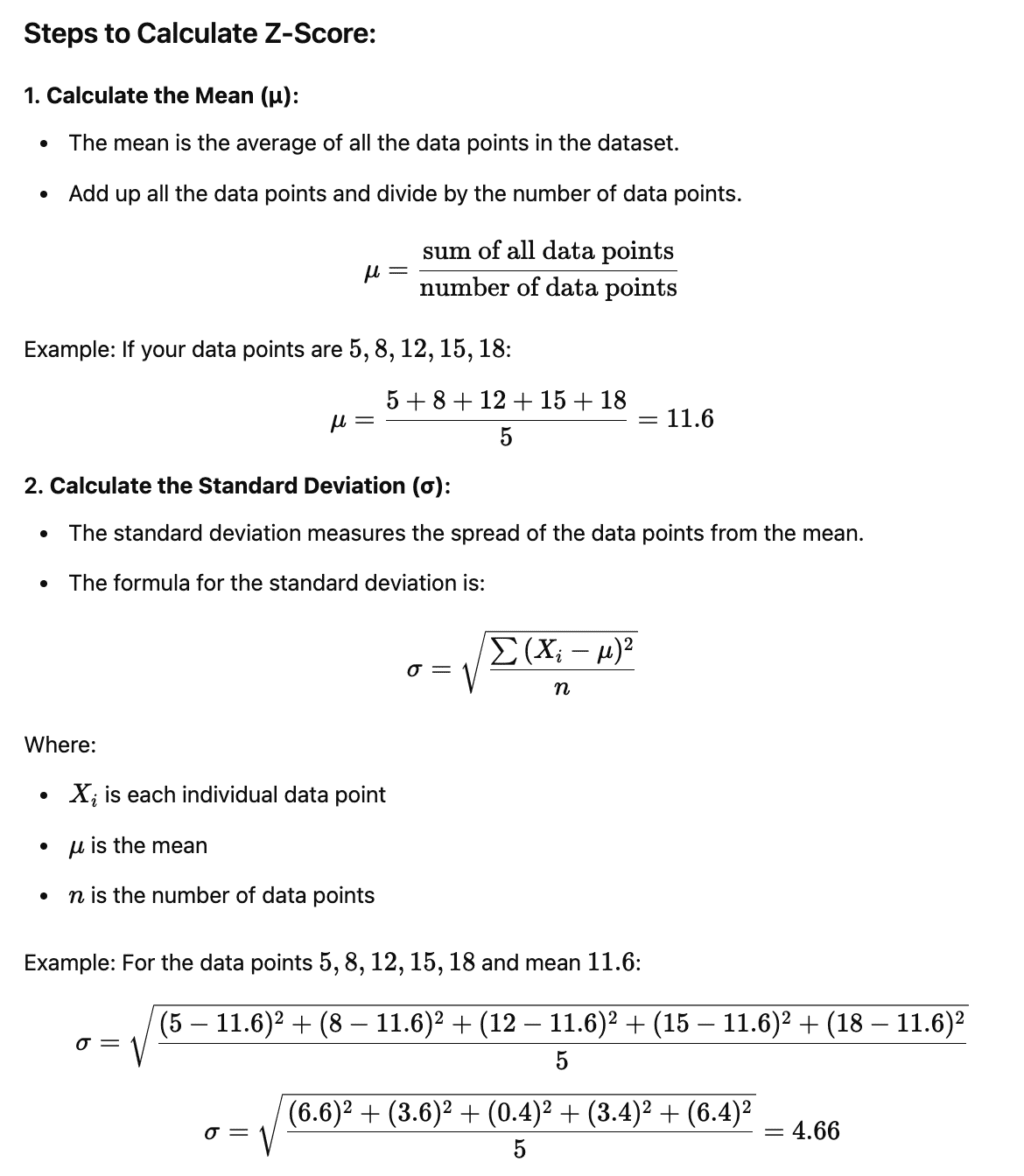
Step 1: Find the Mean (Average)
The first step in calculating a Z score is to determine the mean (average) of the data set. Add all the data points together and divide by the number of data points.
Example: Data set: [10, 15, 20, 25, 30]
Mean (μ) = (10 + 15 + 20 + 25 + 30) / 5 = 100 / 5 = 20
Step 2: Calculate the Standard Deviation
Next, calculate the standard deviation of the data set. The standard deviation measures the dispersion of data points around the mean.
Example:
Step 1: Subtract the mean from each data point and square the result.
(10 – 20)² = 100
(15 – 20)² = 25
(20 – 20)² = 0
(25 – 20)² = 25
(30 – 20)² = 100
Step 2: Find the average of these squared differences.
Sum = 100 + 25 + 0 + 25 + 100 = 250
Variance = 250 / 5 = 50
Step 3: Take the square root of the variance to find the standard deviation (σ).
Standard Deviation (σ) = √50 ≈ 7.07
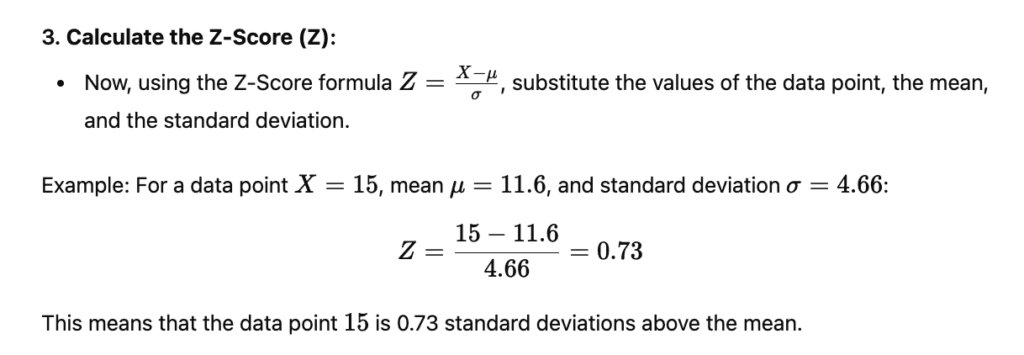
Step 3: Use the Z Score Formula
Now that you have the mean and standard deviation, you can calculate the Z score for any data point in the data set.
Example: Calculate the Z score for the value 25.
Z = (X – μ) / σ
Z = (25 – 20) / 7.07 ≈ 0.71
Final Answer: The Z score for the value 25 is approximately 0.71.
Interpreting Z Scores
Z = 0: The data point is equal to the mean.
Z > 0: The data point is above the mean.
Z < 0: The data point is below the mean.
Z > 2 or Z < -2: The data point is far from the mean, indicating it may be an outlier.
Importance of Z Scores
Standardization: Z scores standardize different data sets, allowing for comparisons even if the data have different units or scales.
Identify Outliers: Z scores help identify outliers—data points that are significantly different from others in the data set.
Probability Calculation: Z scores are used in normal distribution to determine the probability of a data point occurring within a certain range.
Examples of Calculating Z Scores
Example 1: In a class, the average test score is 75 with a standard deviation of 10. If a student scored 85, what is their Z score?
Mean (μ) = 75
Standard Deviation (σ) = 10
Data Point (X) = 85
Z = (X – μ) / σ = (85 – 75) / 10 = 1
Final Answer: The Z score is 1.
Example 2: The average monthly rent in a city is $1,200 with a standard deviation of $150. If a particular apartment has a rent of $1,500, what is the Z score?
Mean (μ) = 1,200
Standard Deviation (σ) = 150
Data Point (X) = 1,500
Z = (X – μ) / σ = (1,500 – 1,200) / 150 = 2
Final Answer: The Z score is 2.
Frequently Asked Questions about Z Score
Q1: What is the formula for calculating a Z score?
The formula for a Z score is:
Where X is the value of the data point, μ is the mean, and σ is the standard deviation.
Q2: What does a Z score tell you?
A Z score indicates how many standard deviations a data point is from the mean. It helps in understanding the relative position of the data point within the distribution.
Q3: Can a Z score be negative?
Yes, a Z score can be negative if the data point is below the mean. A negative Z score indicates that the value is less than the average.
Q4: What is a good Z score?
A Z score close to 0 means the data point is near the mean. Z scores greater than 2 or less than -2 are generally considered unusual or potential outliers.
Q5: How are Z scores used in real life?
Z scores are used in many fields, such as finance (to assess risk), education (to compare test scores), and healthcare (to analyze patient data relative to norms).
Q6: How do you interpret a Z score of 1.5?
A Z score of 1.5 means the data point is 1.5 standard deviations above the mean.
Q7: What is the difference between a Z score and a percentile?
A Z score measures the number of standard deviations away from the mean, while a percentile indicates the percentage of data points below a specific value in a distribution.
Q8: Can Z scores be used for skewed distributions?
Z scores are most useful for normal distributions. If the data is heavily skewed, the interpretation of Z scores may not be as meaningful.
Q9: How do you calculate Z score without standard deviation?
You need both the mean and the standard deviation to calculate a Z score. Without standard deviation, you cannot determine how far a data point is from the mean in standardized terms.
Q10: What is the Z score for the mean value?
The Z score for the mean value is always 0 because it represents the point that is exactly at the average of the distribution.
Conclusion
Calculating the Z score is a valuable skill in statistics that helps you understand the relative position of data points within a distribution. By using the Z score formula, you can determine how far a value is from the mean and make informed decisions based on that information. Whether you’re comparing test scores, analyzing financial data, or interpreting survey results, Z scores provide a standardized way to measure and compare data.
Now that you know how to calculate Z scores, try using them in your own data analysis projects to better understand the significance of different values within your data sets.