Relative Frequency Calculator
Instantly analyze probability subsets. Determine precisely what proportional fraction or decimal percentage a distinct subgroup represents within an absolute total dataset.
📋 Table of Contents
- Interactive Relative Frequency Calculator
- What is Relative Frequency? (Core Definition)
- The Universal Statistical Formulas
- Absolute vs. Relative vs. Cumulative Frequency
- How to Calculate It Step-by-Step (With Examples)
- Creating a Relative Frequency Distribution Table
- Why is it Critical in Probability Theory?
- Common Mathematical Mistakes to Avoid
- Frequently Asked Questions (FAQ)
🧮 Interactive Relative Frequency Calculator
Input the raw occurrences of your distinct event (the subgroup) and the absolute amount of total trials observed. Our built-in statistical engine will instantaneously extrapolate the relative frequency across all three standard probability formats.
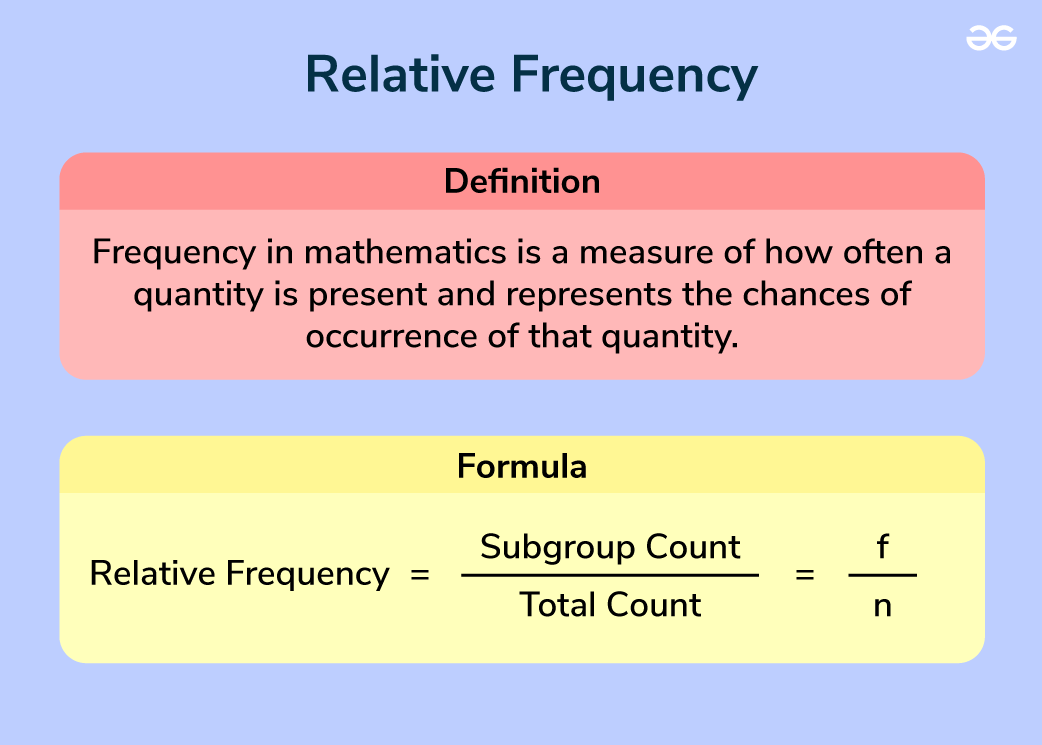
📘 What is Relative Frequency? (Core Definition)
Within the rigorous scientific disciplines of statistics and advanced probability, Relative Frequency is defined strictly as a comparative ratio. It measures precisely how often a specific, unique event occurs divided by the overarching total volume of observational trials executed. Rather than merely stating "this happened 4 times," relative frequency powerfully declares "this happened 4 times absolutely out of 20 total global attempts, making it a 20% slice of reality."
To grasp why this metric represents such a profound paradigm shift beyond simple counting, you must recognize that standalone numbers lack context natively. If a basketball player proudly claims, "I successfully scored exactly 30 free throws," is that impressive? The raw number "30" alone offers zero qualitative insight.
- If he scored 30 throws out of 32 total attempts, he boasts an elite, magnificent level of skill (Rel. Freq = 93.7%).
- If he scored 30 throws out of 200 total attempts, his performance was a monumental, historic disaster (Rel. Freq = 15%).
Relative Frequency physically generates the missing context. It converts useless, hovering raw tallies into highly aggressive, actionable proportional data that statisticians can easily utilize to model trends globally.
📐 The Universal Statistical Formulas
Deriving the relative frequency utilizes highly straightforward mathematical division logic. You identify the subgroup tally and surgically sever it by the absolute total tally matrix.
When analysts derive this outcome, the calculation inherently yields a stark decimal figure naturally hovering between 0 and 1. However, translating this dense mathematical decimal into a universally legible percentage simply requires multiplication logic:
A Fundamental Rule: Because each distinct event constitutes a fraction of the overarching whole, if you carefully calculate the relative frequency of every single unique outcome that transpired across a complete dataset experiment, the final sum of those derived proportions must relentlessly total exactly 1.0 (or definitively 100%).
⚖️ Absolute vs. Relative vs. Cumulative Frequency
A staggering portion of academic grading errors stems from students fundamentally conflating the three primary tiers of statistical frequencies. Let us permanently delineate their categorical differences.
| Statistical Term | Definition | Practical Example Data |
|---|---|---|
| Absolute Frequency | The unedited, raw integer counting exactly how many times a single isolated event occurred. | "I saw absolutely 8 green cars drive by during the entire hour." |
| Relative Frequency | The absolute frequency cleanly divided by the sum of all trials, representing an analytical proportion. | "I observed 40 total cars. Therefore, 8 / 40 = 20% (0.2) were specifically green." |
| Cumulative Frequency | The progressive, running total created by actively adding the frequencies of all ordered historical events up until a defined cutoff point. | "Including the 5 red cars, 2 blue cars, and 8 green cars, the cumulative number of non-white vehicles seen so far currently stands at exactly 15." |
Absolute provides the raw clay. Relative provides the comparative proportion. Cumulative outlines the progressive historical journey of the dataset.
📝 How to Calculate It Step-by-Step (With Examples)
To mathematically calculate the exact ratio manually, perform these sequence-critical steps on your core overarching data set without deviance:
- Gather the Dataset and Establish the Sum Rule: First, you must account for every single observational trial executed within your experiment. You cannot leave data points missing. If you surveyed citizens about their favorite pets, compile all answers definitively together.
- Isolate Your Target Subgroup Frequency (f): Mathematically define precisely what conditional event you are querying. Count how many total times this specific event happened. Example: You found that exactly 35 people surveyed preferred massive dogs.
- Establish the Total Count Magnitude (n): Add together the frequencies of absolutely every single category to find the overall universe size. If 35 preferred dogs, 15 preferred cats, and 10 preferred birds, your supreme total (n) equates to rigidly 60.
- Execute Division: Divide the specific target event (f) by the overarching global total (n). Calculation = 3560
- Synthesize the Decimals: The fractional equation 35/60 reduces accurately to a raw repeating decimal mathematically structured as 0.5833...
- Transpose to Percentage Formulation: Aggressively multiply the core decimal layout by 100 to shift the decimal boundary cleanly. This ultimately generates a 58.33% categorical relative frequency.
📊 Creating a Relative Frequency Distribution Table
When analysts process large, chaotic datasets featuring multiple categories simultaneously, they must rely heavily upon organizing the disparate metrics visually into a formal Relative Frequency Distribution Table. This universally standard spreadsheet matrix immediately clarifies data dispersion across a spectrum.
Consider a rigorous experimental trial rolling a simple physical six-sided die precisely 50 times in succession. Here is how the distribution table perfectly maps the chaotic outcome events:
| Dice Face Generated | Absolute Frequency (Count) | Relative Frequency (Fraction) | Relative Frequency (Decimal) |
|---|---|---|---|
| Rolled a 1 | 8 | 8 / 50 | 0.16 (16%) |
| Rolled a 2 | 12 | 12 / 50 | 0.24 (24%) |
| Rolled a 3 | 7 | 7 / 50 | 0.14 (14%) |
| Rolled a 4 | 9 | 9 / 50 | 0.18 (18%) |
| Rolled a 5 | 11 | 11 / 50 | 0.22 (22%) |
| Rolled a 6 | 3 | 3 / 50 | 0.06 (6%) |
| Column Summation Check | Total = 50 | 50 / 50 | Total = 1.00 (100%) |
Notice the critical summation check rigorously performed on the absolute bottom row. This mathematical law acts natively as an error-catching safety protocol. If your derived decimal calculations add rigidly up to 0.95 or wildly to 1.15, you have committed an arithmetic procedural failure and must systematically recalculate your fractional divisions immediately.
🌟 Why is it Critical in Probability Theory?
Relative frequency serves fundamentally as the sturdy conceptual bridge connecting purely experimental, chaotic reality directly to sterile, rigid mathematical theory. In high-level probabilistic theory, we natively expect a coin perfectly flipped to violently land fundamentally on 'Heads' precisely 50% of the statistical time. This is classified as entirely Theoretical Probability.
However, reality actively defies perfection. If you physically flip a heavily worn coin exactly 10 times in reality, you will frequently witness highly skewed outcomes, such as 7 total Heads and 3 mere Tails. Your observed relative frequency for Heads fundamentally becomes precisely 0.70 (70%).
Statisticians rely immensely on calculating relative frequency continuously from incredibly vast sample sizes because empirical data eventually forces complex experimental outcomes to merge directly toward their predestined theoretical probabilities. When a theoretical probability is entirely unknown (for instance, the complex probability of a highly controversial surgical procedure critically failing), mathematicians map the historical relative frequencies of completely identical past real-world surgeries forcefully to establish the active, modern predictive baseline odds securely referenced by prominent healthcare boards across the globe.
❌ Common Mathematical Mistakes to Avoid
When computing massive datasets under extreme pressure or tight exam deadlines, individuals frequently make completely avoidable, devastating mathematical infractions that utterly ruin categorical distributions.
- Excluding Null Datasets from the Total (n): If you are counting survey feedback logic and absolutely 10 individuals selected the specific "No Opinion" conditional response, you cannot simply throw those 10 datasets into the metaphorical garbage. They are incredibly vital events representing an active statistical choice. They must be aggressively fundamentally tallied into the overarching total number of trials (n). Omitting them mathematically inflates all remaining subset frequencies artificially.
- Mixing Up Variables During Algorithmic Division: A tragic error structurally involves accidentally plugging the grand total into the exact top fractional numerator location. If your absolute subset frequency is purely 10 explicitly out of 100 trials, the equation is 10 / 100 = 0.1. If you clumsily execute 100 / 10, you procure 10, incorrectly projecting a completely chaotic 1000% occurrence frequency! Remember logically: subset fundamentally always belongs distinctly on top.
- Excessive Premature Decimal Rounding: If you severely round fractional division decimals far too aggressively during the initial preliminary equations (rounding exactly 0.124 explicitly simply to 0.1), your final cumulative total across massive charts will inherently plummet, failing to reach 100% and completely corrupting the data's absolute integrity.
❓ Frequently Asked Questions (FAQ)
HeLovesMath.com — High-Performance Empirical Statistics Tools & Analytical Homework Calculators
© 2026 HeLovesMath. All interactive statistical algorithmic tools are securely structurally provided completely freely openly for explicit scholastic, educational, and stringent analytical research purposes directly.
Return to HeLovesMath Directory