Free Printable Multiplication Charts - Times Tables Generator
Table of Contents
What is a Multiplication Chart?
A multiplication chart, also known as a times table chart or multiplication grid, is a visual reference tool that displays the products of multiplying numbers within a specific range, typically from 1×1 through 12×12. The chart is organized in a grid format with multipliers arranged along the top row and left column, and their products displayed at the intersection points. This systematic arrangement allows students to quickly locate any multiplication fact by finding where a row and column meet.
Multiplication charts serve as fundamental learning tools in mathematics education worldwide. They transform abstract multiplication concepts into concrete, visual representations that students can see, touch, and internalize. When a student wants to find the answer to 6 × 8, they simply locate 6 on the left side and 8 across the top, then trace to where the row and column intersect to find the product: 48. This visual-spatial approach supports multiple learning styles and helps students who struggle with rote memorization.
The educational value of multiplication charts extends beyond simple fact lookup. These charts reveal fundamental mathematical properties and patterns that deepen conceptual understanding. Students discover that multiplication is commutative (3 × 4 equals 4 × 3), observe the symmetry along the diagonal, recognize sequences like square numbers (1, 4, 9, 16, 25), and identify patterns in multiples (all multiples of 5 end in 0 or 5). This pattern recognition builds number sense and mathematical reasoning skills that transfer to more advanced topics like algebra and calculus.
Interactive Multiplication Charts Generator
Customize and generate your own multiplication chart below. Adjust the size, colors, and highlighting options to create the perfect study tool.
Advanced Multiplication Charts Generator
Create customized multiplication tables for printing or learning
Multiplication Formulas and Concepts
Understanding the mathematical principles behind multiplication charts strengthens conceptual knowledge and helps students progress from memorization to true mathematical reasoning. Multiplication represents repeated addition and forms the foundation for division, fractions, ratios, algebra, and beyond.
Basic Multiplication Definition
Multiplication as repeated addition:
Example: 4 × 3 = 4 + 4 + 4 = 12
This formula shows that multiplying means adding a number to itself a specific number of times. When we calculate 5 × 6, we're adding five to itself six times: 5 + 5 + 5 + 5 + 5 + 5 = 30. This understanding helps students grasp why multiplication produces larger numbers and connects to real-world scenarios like counting groups of objects.
Commutative Property of Multiplication
Order doesn't matter in multiplication:
Example: 7 × 8 = 8 × 7 = 56
The commutative property is one of the most powerful insights from multiplication charts. It means that 3 groups of 4 objects equals 4 groups of 3 objects—both give 12 total. This property effectively cuts memorization in half: if you know 9 × 6 = 54, you automatically know 6 × 9 = 54. Visually, this creates the symmetrical pattern seen along the diagonal of multiplication charts.
Associative Property of Multiplication
Grouping doesn't affect the product:
Example: (2 × 3) × 4 = 2 × (3 × 4) = 24
This property becomes essential in mental math and algebra. It allows students to rearrange multiplication problems for easier calculation. For instance, to calculate 5 × 13 × 2, students can rearrange to (5 × 2) × 13 = 10 × 13 = 130, making the problem much simpler.
Distributive Property
Multiplication distributes over addition:
Example: 6 × (10 + 2) = (6 × 10) + (6 × 2) = 60 + 12 = 72
The distributive property is crucial for mental multiplication strategies. When calculating 7 × 12, students can think of it as 7 × (10 + 2) = (7 × 10) + (7 × 2) = 70 + 14 = 84. This breaking-down strategy makes larger multiplication problems manageable and builds number flexibility.
Identity and Zero Properties
Special multiplication rules:
Zero Property: a × 0 = 0
Examples: 9 × 1 = 9, 15 × 0 = 0
These fundamental properties appear in every multiplication chart's first row and column. Multiplying by 1 leaves a number unchanged (the identity), while multiplying by zero always produces zero. Understanding these properties prevents confusion and errors in more complex calculations.
Quick Reference: Common Multiplication Facts
| Times Table | Key Pattern | Example Facts |
|---|---|---|
| 2s | All even numbers; count by 2s | 2, 4, 6, 8, 10, 12... |
| 5s | All end in 0 or 5 | 5, 10, 15, 20, 25, 30... |
| 9s | Digits sum to 9; subtract 1 and add complement | 9, 18 (1+8=9), 27 (2+7=9)... |
| 10s | Add a zero to the multiplier | 10, 20, 30, 40, 50... |
| 11s | Repeat the digit (for single digits) | 11, 22, 33, 44, 55... |
| Squares | Number multiplied by itself | 1, 4, 9, 16, 25, 36, 49... |
How This Generator Works
Calculation Methodology
This multiplication charts generator uses programmatic logic to create customizable times tables based on mathematical principles. Understanding how the tool works helps users maximize its educational value and customize outputs for specific learning needs.
Step 1: Input Collection and Validation - The generator collects user preferences including chart size (how many numbers to include), starting number (typically 1 but adjustable for advanced practice), color scheme preferences, cell size for readability, and whether to highlight specific multiples. All inputs are validated to ensure they fall within acceptable ranges: chart size between 1-20, non-negative starting numbers, and valid color hexadecimal codes.
Step 2: Grid Structure Generation - The generator creates a two-dimensional array (table) with dimensions based on the specified chart size. For a 12×12 chart, it creates a grid with 13 rows and 13 columns (the extra row and column are for headers). The first row contains column headers (multipliers across the top), and the first column contains row headers (multipliers down the side). This grid structure mirrors traditional multiplication charts students encounter in textbooks.
Step 3: Product Calculation - For each cell in the grid (excluding headers), the generator calculates the product by multiplying the row number by the column number. The calculation uses the formula: celli,j = rowi × columnj. For example, the cell at row 4, column 7 displays 4 × 7 = 28. These calculations happen instantaneously using JavaScript's multiplication operator, ensuring accuracy across all 144 cells (for a standard 12×12 chart).
Step 4: Pattern Highlighting - When users specify multiples to highlight (like highlighting all multiples of 3), the generator uses the modulo operator to identify qualifying cells. For each product, it calculates product % highlight_value; if the remainder is 0, the cell is a multiple and receives highlighting formatting (typically a yellow background). This feature helps students visualize patterns and identify number relationships within the multiplication table.
Step 5: Styling and Formatting - The generator applies CSS styling based on user preferences: header colors use the selected color scheme, cell sizes adjust font size and padding (small: 14px font with 8px padding, medium: 16px with 12px padding, large: 18px with 16px padding), zebra striping alternates background colors on even rows for improved readability, and borders separate cells for clear visual distinction. All styling follows responsive design principles to ensure charts display correctly on various screen sizes.
Step 6: Output Generation - The completed chart is rendered as an HTML table element and inserted into the page's chart container. The generator simultaneously creates a print-friendly version by applying print-specific CSS that removes interface elements (buttons, color selectors) and optimizes the chart for paper output. Users can print directly from their browser, copy the table data to clipboard as tab-separated values for spreadsheet programs, or save as a PDF for digital distribution.
Uses of Multiplication Charts
Multiplication charts serve diverse purposes across educational settings, home learning environments, and practical applications. Understanding these uses helps students, parents, and educators maximize the benefits of this foundational mathematical tool.
Building Mathematical Fluency
Fluency in multiplication facts is a core educational goal for elementary mathematics. Multiplication charts accelerate fluency development by providing immediate visual feedback when students practice recall. Instead of waiting for teacher confirmation or searching for answers in the back of a workbook, students can instantly verify their mental calculations against the chart. This immediate feedback loop strengthens neural pathways and builds confidence. Research demonstrates that students who achieve multiplication fluency perform better in fractions, decimals, algebra, and higher mathematics throughout their academic careers.
Supporting Pattern Recognition Skills
Mathematical pattern recognition is a critical thinking skill that transfers across all STEM disciplines. Multiplication charts reveal numerous patterns that develop this skill: square numbers appear along the diagonal (1, 4, 9, 16, 25, 36), multiples of 9 have digits that sum to 9 (18: 1+8=9, 27: 2+7=9, 36: 3+6=9), the chart displays perfect symmetry across its diagonal demonstrating the commutative property, and sequences like triangular numbers and pentagonal numbers can be identified by students who look carefully. Teachers at helovesmath.com emphasize pattern discovery as a more engaging approach than rote memorization.
Classroom Teaching and Assessment
Educators use multiplication charts as versatile teaching tools in numerous ways. During direct instruction, teachers project large charts to demonstrate multiplication concepts and properties visually. For formative assessment, partially completed charts identify which facts students know and which need more practice. Group activities like "multiplication chart races" create competitive, engaging practice where teams compete to fill blank charts fastest. Differentiation becomes possible when teachers provide charts with varying levels of completion—struggling students get more filled-in charts while advanced students work with blanks. Special education teachers particularly value charts as visual supports for students with learning differences.
Homework and Independent Practice
Parents and students use multiplication charts for effective home practice. Charts serve as answer keys for self-checking multiplication homework, reducing frustration and building independence. Students preparing for timed multiplication tests use charts to identify weak areas requiring focused practice. During homework sessions, having a chart nearby reduces anxiety and keeps students moving forward when they temporarily forget a fact. Parents who feel uncertain about helping with math homework can rely on charts as accurate reference tools. The visual nature of charts also makes them more engaging than flashcards for many learners, particularly those with visual learning preferences.
Test Preparation and Standardized Assessments
Standardized tests from elementary through high school assume multiplication fact fluency. Students preparing for state assessments, the SAT, ACT, GRE, or professional licensing exams benefit from reviewing multiplication charts to ensure automatic recall. Many timed tests prohibit calculators in sections where multiplication facts appear, making mental math skills essential. Quick multiplication fluency also reduces cognitive load during tests, freeing working memory for complex problem-solving. Students at helovesmath.com use multiplication charts as diagnostic tools—if chart reference is still needed for basic facts, more practice is necessary before high-stakes testing.
Real-World Applications and Life Skills
Beyond academic settings, multiplication knowledge supports everyday life. Shopping calculations benefit from quick multiplication: comparing unit prices, calculating discounts, or determining total costs for multiple items. Cooking and baking require multiplication when scaling recipes (doubling a recipe that serves 4 to serve 8). Home improvement projects involve multiplication for calculating square footage, material quantities, or cost estimates. Time management uses multiplication concepts (if one task takes 15 minutes, how long for 6 tasks?). Financial literacy builds on multiplication for calculating interest, investment returns, and budgeting. Parents who master multiplication facts model mathematical confidence and problem-solving for their children.
Special Education and Learning Support
Students with learning differences particularly benefit from multiplication charts' visual-spatial approach. Dyscalculia, a specific learning disability affecting number sense, is supported by visual references that compensate for weak numerical memory. ADHD students who struggle with rote memorization tasks can use charts to reduce frustration and maintain engagement. Visual learners process mathematical information more effectively through spatial arrangements than verbal instruction alone. English language learners benefit from charts' universal number language that transcends vocabulary limitations. Multiplication charts level the playing field, allowing diverse learners to access mathematical content through their strengths rather than struggling with weaknesses.
How to Use Multiplication Charts Effectively
Maximizing the educational value of multiplication charts requires strategic approaches beyond simple lookup. Follow these evidence-based methods to build lasting multiplication fluency using charts as learning tools rather than crutches.
Step 1: Start with Foundational Tables
Begin with the easiest multiplication facts to build confidence and create early success experiences. Focus initial practice on the 1s, 2s, 5s, and 10s times tables, as these follow simple, recognizable patterns. The 1s table (identity property) shows that any number times 1 equals itself. The 2s table is simply counting by twos—a skill most students already have. The 5s table produces numbers ending in 0 or 5, creating an obvious pattern. The 10s table just adds a zero to the multiplier. Master these four tables completely before progressing, typically requiring 1-2 weeks of 15-minute daily practice sessions.
Once foundational tables are solid, introduce the 9s table using the finger trick: hold up both hands, fold down the finger representing the multiplier (for 9×4, fold the 4th finger from the left), then count fingers to the left of the folded finger for tens place (3) and to the right for ones place (6), giving 36. This trick makes the 9s table memorable and fun while teaching a valuable mental math strategy.
Step 2: Practice Pattern Recognition
Transform charts from lookup tools to discovery platforms by actively identifying mathematical patterns. Use colored pencils or highlighters to mark specific patterns: highlight all square numbers along the diagonal in one color (1, 4, 9, 16, 25, 36, 49, 64, 81, 100, 121, 144), mark all multiples of 3 in another color to see the diagonal pattern they create, circle all products that appear multiple times (like 12, which appears at 2×6, 3×4, 4×3, and 6×2), and draw a line of symmetry through the diagonal to demonstrate the commutative property.
Create pattern discovery challenges: "How many different ways can we make 24? Can you find all the prime numbers in the chart? What pattern do you notice in the ones digits of the 4s table?" These activities build mathematical reasoning and number sense rather than just memorization. Students begin to understand multiplication relationships rather than treating facts as disconnected pieces of information to remember.
Step 3: Progressive Chart Filling
Use blank or partially completed charts for active practice rather than passive reference. Start with charts that have the easiest facts filled in (1s, 2s, 5s, 10s, and the diagonal) and challenge students to complete the remaining cells. As mastery improves, provide increasingly empty charts until students can complete a fully blank 12×12 chart from memory. Time these exercises to track improvement—students should eventually complete a full chart in under 5 minutes with 100% accuracy.
Create a progressive practice routine: Monday—fill in all 2s, 5s, and 10s facts; Tuesday—add 3s and 4s; Wednesday—incorporate 6s and 8s; Thursday—tackle 7s and 9s; Friday—complete the entire chart under timed conditions. This scaffolded approach prevents overwhelm while ensuring systematic coverage of all facts. Celebrate progress by keeping completed charts in a folder, showing visual evidence of growing mastery.
Step 4: Play Educational Games
Gamification increases engagement and retention while making practice enjoyable rather than tedious. Play "Multiplication Chart Bingo" where the caller announces problems (6×7) and players mark the products (42) on bingo cards showing various chart numbers. Create "Chart Races" where teams compete to correctly fill in blank sections of multiplication charts fastest, with accuracy bonuses. Use "Multiplication Chart Four Corners" where each corner represents a different times table (2s, 5s, 9s, 11s), students move to corners, and the teacher calls problems for those tables—students who answer correctly stay in the game.
Digital options include apps and websites offering interactive multiplication chart games with immediate feedback, adaptive difficulty that adjusts to student performance, and progress tracking that motivates continued practice. Sites like helovesmath.com provide printable game materials and instructions for parents and teachers to facilitate engaging practice sessions.
Step 5: Connect to Real-World Applications
Mathematical understanding deepens when students see how multiplication facts solve real problems. When grocery shopping, challenge students: "If each apple costs $0.75, how much will 8 apples cost?" (8×75¢). During cooking, ask: "The recipe serves 4 but we need to serve 12. That's 3 times the recipe, so if we need 2 cups of flour, how much do we need now?" (3×2). When planning activities: "Soccer practice lasts 90 minutes. If we go 3 times per week, how many minutes is that?" (3×90).
Create multiplication word problem sets that require chart reference initially but build toward independence. The real-world context makes facts meaningful rather than abstract, improving retention through multiple memory pathways—students remember both the calculation process and the context where it was used.
Step 6: Gradual Transition to Mental Math
Charts should be learning bridges, not permanent supports. Plan deliberate weaning from chart dependency by first using the chart freely during all multiplication work, then covering specific rows or columns students have mastered, next allowing chart access only for checking answers after attempting problems mentally, and finally removing charts entirely except for occasional verification. This graduated approach builds confidence while preventing the anxiety that sometimes occurs when supports are removed too quickly.
Set specific mastery goals: "This week we're learning 7×8, 8×7, 7×7, and 8×8 by heart." Practice these facts intensively through flashcards, verbal quizzing, and timed drills until they're automatic (answers come within 3 seconds). Once mastered, those facts are "locked in" and the chart is no longer needed for them. Gradually, the entire chart becomes internalized through this targeted approach.
Frequently Asked Questions
Official Educational Resources
Authoritative References
This multiplication charts generator is built on established educational research and mathematical principles. The following official resources provide authoritative information on teaching and learning multiplication:
- Multiplication.com - Leading resource for helping students master multiplication facts through games, worksheets, and interactive activities aligned with Common Core standards.
- Super Teacher Worksheets - Multiplication Tables - Comprehensive collection of printable multiplication charts, tables, and worksheets for classroom and home use.
- UK National Curriculum - Mathematics (PDF) - Official government curriculum document outlining multiplication learning standards for key stages 1 and 2, requiring mastery of times tables up to 12×12.
- UK Department for Education - Multiplication Tables Check - Official explanation of the statutory multiplication tables check for Year 4 students and its importance for mathematical development.
- Suncatcher Studio - Free Printable Multiplication Charts - Educational resource providing free downloadable PDF multiplication charts in various formats and color schemes.
About helovesmath.com
He Loves Math is dedicated to making mathematics accessible, engaging, and understandable for students at all levels. Our multiplication charts generator reflects our commitment to providing free, high-quality educational tools that support both classroom learning and independent study. We believe every student can achieve mathematical fluency with the right resources and practice strategies.
Looking for printable multiplication charts? I’m excited to offer a wide selection of free and customizable multiplication tables for students of all ages.
Simplify learning with these easy-to-use charts that are perfect for classroom or home use. Download and print now to help your child or student master multiplication.
I created this set of free printable multiplication charts which include 12 x 12, 15 x 15, and 20 x 20 multiplication grids. I was inspired to create this free downloadable file after searching online and not being able to find exactly what I was looking for.

I ended up creating five different multiplication table versions. I have uploaded these times tables as PDFs and editable Publisher files at the bottom of this post. I’m hoping someone else will also find these useful for their own classrooms!

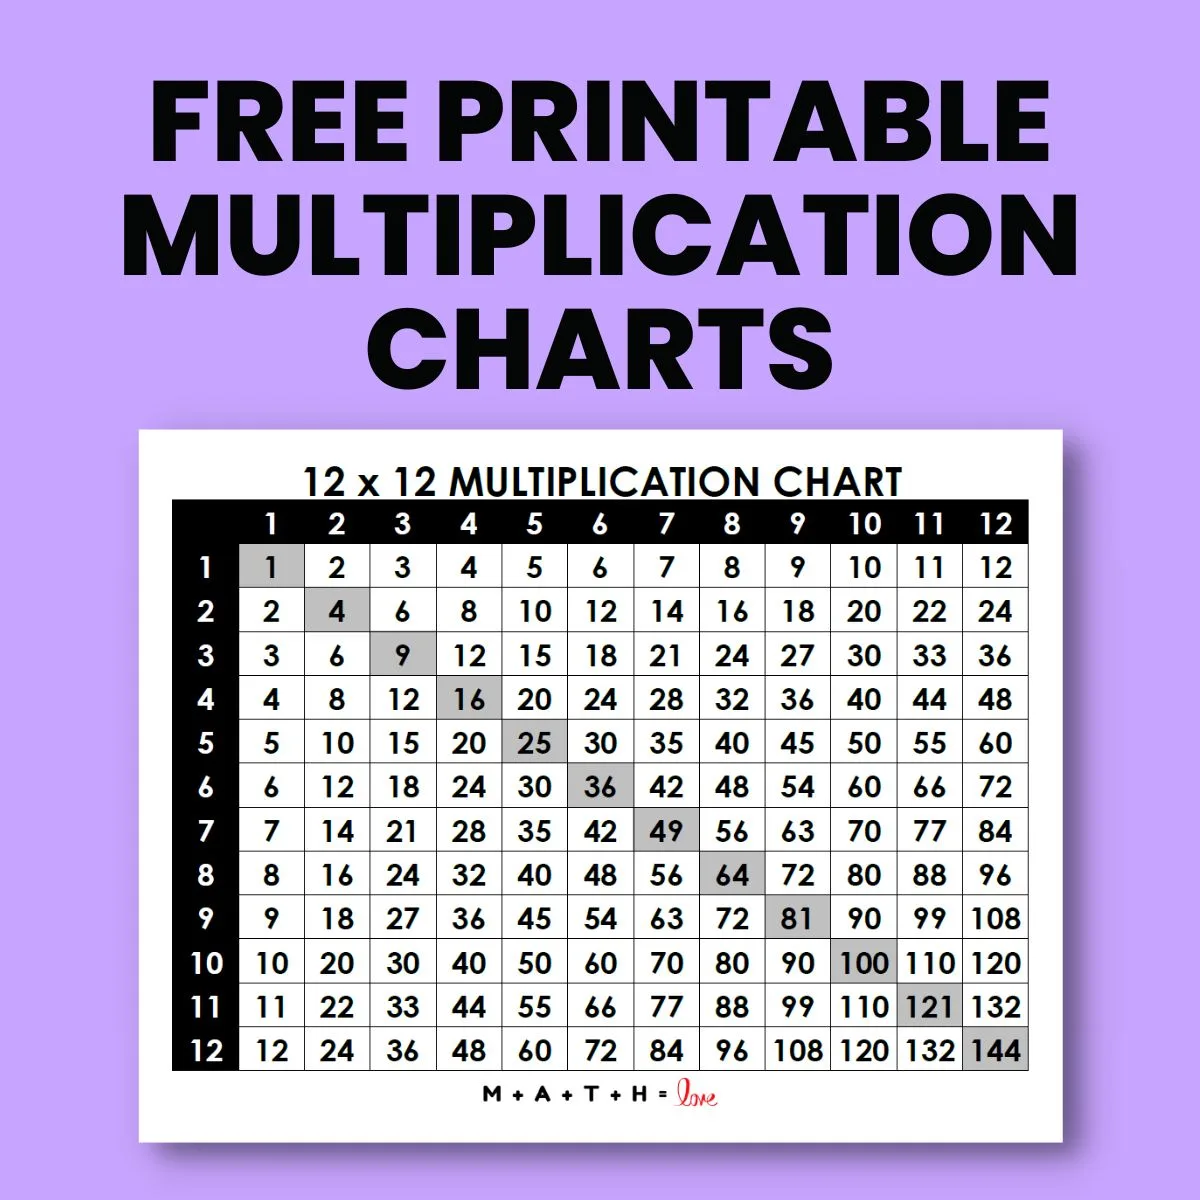
12 x 12 Multiplication Chart
The first multiplication chart I created is a standard 12 by 12 multiplication table. The perfect squares from 1 to 144 are highlighted on the main diagonal of the grid.

15 x 15 Multiplication Chart
I created two versions of the 15 by 15 multiplication chart. For the first version, I highlighted the multiples of 5 on the chart to make it hopefully easier to read the chart since it sort of breaks it up into sections.

The second version of the 15 x 15 multiplication table has the perfect squares highlighted along the diagonal of the chart instead.

20 x 20 Multiplication Chart
I find that my students often benefit from a multiplication chart that goes up to 20. Like the 15 x 15 multiplication table, I highlighted the multiples of five on the first version of the chart.

I think the 20 x 20 multiplication table is the most helpful for high school students. Often, I use multiplication charts with my students who are struggling with concepts such as factoring polynomials in Algebra.
For the second version of the 20 by 20 multiplication chart, I highlighted the perfect squares along the diagonal of the grid.
")
Free Printable Multiplication Chart Download (PDF)
Want to print some or all of these multiplication tables for your own classroom? I’ve got you covered with a free PDF download! Want to make some changes to the chart? You can also download a ZIP file including an editable Publisher file.
Multiplication Charts (PDF) (22503 downloads )
Multiplication Charts (Editable Publisher File ZIP) (2857 downloads )
50 Frequently Asked Questions (FAQs) about “Printable Multiplication Charts,” each accompanied by detailed answers to help you understand their uses, benefits, customization options, and more.
1. What is a Printable Multiplication Chart?
A printable multiplication chart is a visual tool that displays multiplication facts in a grid format, typically ranging from 1×1 to 12×12 or higher. It serves as a reference to help students memorize and understand multiplication tables. These charts can be printed on paper or other materials and are widely used in educational settings, homes, and tutoring centers to aid in math learning.
2. How Can Printable Multiplication Charts Help Students?
Printable multiplication charts aid students by:
- Visual Learning: Providing a clear, organized display of multiplication facts.
- Memorization: Helping students memorize multiplication tables through repetition and reference.
- Self-Study: Allowing students to independently study and practice multiplication.
- Problem Solving: Serving as a quick reference during math problems, reducing calculation time.
- Confidence Building: Enhancing students’ confidence in handling multiplication tasks.
3. Where Can I Find Free Printable Multiplication Charts?
Free printable multiplication charts can be found on various educational websites, including:
- Math-Drills.com
- Education.com
- K5 Learning
- Teachers Pay Teachers (free resources section)
- Twinkl
- Printable-math-worksheets.com
These sites offer a variety of styles and formats to suit different learning needs.
4. What Are the Different Types of Printable Multiplication Charts?
Printable multiplication charts come in various types, including:
- Standard Grid Charts: Simple grids displaying multiplication facts.
- Color-Coded Charts: Use colors to differentiate numbers or highlight patterns.
- Interactive Charts: Include elements like blank spaces for students to fill in.
- Themed Charts: Incorporate themes such as animals, space, or sports to engage students.
- Foldable Charts: Designed to be folded for easy storage and portability.
- Large Print Charts: Bigger fonts and spacing for easier reading.
5. Can Printable Multiplication Charts Be Customized?
Yes, printable multiplication charts can be customized to meet specific needs. Customization options include:
- Color Schemes: Choosing different colors for rows, columns, or specific numbers.
- Size and Layout: Adjusting the size of the chart or changing the layout to portrait or landscape.
- Themes: Adding themes like holidays, animals, or characters to make learning more engaging.
- Additional Information: Including tips, tricks, or multiplication strategies alongside the chart.
- Blank Spaces: Creating spaces for students to write in answers or notes.
Customizable charts can be created using software like Microsoft Word, Excel, or specialized educational design tools.
6. Are Printable Multiplication Charts Suitable for All Grade Levels?
Printable multiplication charts are primarily designed for elementary school students, typically from 1st to 5th grade, who are learning multiplication. However, they can also be useful for older students who need a quick reference or for adults revisiting multiplication skills. The complexity and size of the chart can be adjusted to suit different grade levels and learning stages.
7. How Do I Use a Printable Multiplication Chart Effectively?
To use a printable multiplication chart effectively:
- Display It Prominently: Place the chart where the student can easily see and reference it.
- Daily Review: Encourage daily practice and referencing during study sessions.
- Interactive Learning: Use the chart for games, quizzes, and interactive activities.
- Highlight Patterns: Teach students to recognize patterns, such as the commutative property (e.g., 3×4 = 4×3).
- Use as a Reference: Allow students to use the chart when solving math problems to build confidence.
- Incorporate in Homework: Include chart-based questions in homework assignments to reinforce learning.
8. What Are the Benefits of Using a Printable Multiplication Chart?
Benefits include:
- Enhanced Memory: Aids in memorizing multiplication facts.
- Improved Confidence: Reduces anxiety around multiplication by providing a reliable reference.
- Visual Aid: Helps visual learners understand multiplication concepts.
- Flexible Learning Tool: Can be used in various settings—classroom, home, tutoring.
- Accessible Resource: Easily accessible and reusable without the need for digital devices.
- Cost-Effective: Generally free or low-cost compared to other educational materials.
9. Can Printable Multiplication Charts Be Used for Teaching Other Math Concepts?
Yes, they can be used to teach:
- Addition and Subtraction Patterns: Observing how addition and subtraction relate to multiplication.
- Division: Understanding multiplication as the inverse of division.
- Number Patterns: Identifying multiples, factors, and prime numbers.
- Arithmetic Operations: Combining with other operations for complex problem-solving.
- Geometry Concepts: Relating multiplication to area calculations and geometric shapes.
10. What Features Should I Look for in a Printable Multiplication Chart?
Key features include:
- Clarity: Clear and legible fonts and numbers.
- Organization: Well-structured grid layout for easy navigation.
- Color Coding: Helps differentiate sections and highlight patterns.
- Durability: Use of high-quality paper or lamination for long-term use.
- Customization Options: Ability to personalize the chart to suit specific needs.
- Interactive Elements: Spaces for students to engage actively with the chart.
- Supplementary Information: Inclusion of tips, tricks, or multiplication strategies.
11. How Can I Make Learning Multiplication Fun with Printable Charts?
To make learning fun:
- Coloring Activities: Let students color-code different parts of the chart.
- Games and Challenges: Create games like “Find All Multiples of 5” or timed quizzes.
- Interactive Worksheets: Use charts as part of puzzle or matching activities.
- Rewards and Incentives: Reward students for mastering sections of the chart.
- Incorporate Themes: Use themed charts that interest the student, such as superheroes or animals.
- Storytelling: Integrate multiplication facts into stories or real-life scenarios.
12. Are There Printable Multiplication Charts Available for Different Languages?
Yes, printable multiplication charts are available in multiple languages to support diverse learners. For example:
- Spanish Multiplication Charts: For Spanish-speaking students.
- French, German, Chinese, etc.: Charts tailored to various languages.
- Bilingual Charts: Include multiplication facts in two languages for bilingual education.
- Language-Specific Resources: Some educational websites offer charts tailored to specific linguistic needs.
These multilingual charts help non-native speakers learn multiplication in their preferred language, enhancing comprehension and retention.
13. Can Printable Multiplication Charts Be Used for Remote Learning?
Absolutely. Printable multiplication charts are ideal for remote learning as they:
- Accessible Offline: Students can download and print charts without needing internet access during study.
- Easy to Share: Teachers can distribute charts via email or learning management systems.
- Consistent Reference: Serve as a consistent learning tool across different learning environments.
- Supports Self-Paced Learning: Allows students to study and reference the chart at their own pace.
14. How Do I Choose the Right Printable Multiplication Chart for My Child?
Consider the following when choosing a chart:
- Age and Grade Level: Ensure the chart matches the child’s educational level.
- Learning Style: Choose color-coded or interactive charts if the child is a visual or kinesthetic learner.
- Customization Needs: Select charts that can be personalized to engage the child.
- Durability: Opt for laminated or sturdy paper if the chart will be frequently handled.
- Design Preferences: Pick designs that the child finds appealing to increase interest.
- Supplementary Features: Look for charts that include tips, patterns, or additional resources.
15. Can I Create My Own Printable Multiplication Chart?
Yes, you can create your own chart using tools like:
- Microsoft Excel or Google Sheets: Easily create grids and format them to your preference.
- Canva: Offers templates and design elements for customized charts.
- Adobe Illustrator or InDesign: For more advanced design options.
- Word Processors: Simple charts can be made using tables in Microsoft Word or Google Docs.
Creating your own allows for complete customization, including color schemes, themes, and additional information tailored to your child’s needs.
16. Are Printable Multiplication Charts More Effective Than Digital Ones?
Both printable and digital charts have their advantages:
- Printable Charts:
- Tactile Learning: Physical interaction can enhance memory.
- No Screen Time: Reduces reliance on digital devices.
- Ease of Access: Can be placed anywhere for quick reference.
- Digital Charts:
- Interactive Features: May include animations and interactive elements.
- Portability: Accessible on multiple devices.
- Dynamic Updates: Easily updated or customized.
Effectiveness depends on the learner’s preferences and learning style. Combining both can offer a comprehensive learning experience.
17. How Can Teachers Incorporate Printable Multiplication Charts into Their Curriculum?
Teachers can incorporate charts by:
- Displaying in the Classroom: As a constant reference tool on walls or desks.
- Integrating into Lessons: Using charts during teaching multiplication concepts.
- Assignments and Homework: Assigning chart-based activities and quizzes.
- Interactive Activities: Creating group activities or games centered around the chart.
- Assessment Tool: Using the chart to assess students’ understanding and memorization.
- Personalized Learning: Providing individualized charts to cater to different learning paces.
18. Are There Printable Multiplication Charts for Special Education Needs?
Yes, there are printable multiplication charts designed for special education, featuring:
- Simplified Layouts: Less cluttered designs for easier comprehension.
- Larger Fonts and High Contrast: Enhances readability for visually impaired students.
- Tactile Elements: Charts with textures or raised elements for tactile learning.
- Multisensory Designs: Incorporating colors, patterns, and interactive elements.
- Language Support: Bilingual charts or those with simplified language for learners with language processing needs.
These specialized charts cater to diverse learning requirements, ensuring all students can effectively learn multiplication.
19. Can I Laminate Printable Multiplication Charts for Durability?
Yes, laminating printable multiplication charts is a great way to increase their durability. Laminated charts:
- Resist Wear and Tear: Last longer despite frequent use.
- Waterproof: Protect against spills and moisture.
- Reusable: Can be used with dry-erase markers for interactive learning and repeated use.
- Easy to Clean: Wipe clean without damaging the chart.
Lamination makes the chart a long-lasting educational tool that can withstand regular handling.
20. What Are Some Creative Ways to Use Printable Multiplication Charts at Home?
Creative uses include:
- Framing and Hanging: As decorative and educational wall art.
- Learning Games: Creating bingo, matching, or scavenger hunt games based on the chart.
- Daily Challenges: Assigning daily multiplication facts to memorize from the chart.
- Interactive Boards: Using the chart on a whiteboard or bulletin board for group learning.
- Incorporating in Crafts: Cutting out sections for creative projects or personalized study aids.
- Reward Systems: Marking mastered facts on the chart as part of a reward system.
These approaches make learning multiplication engaging and integrated into daily activities.
21. How Do I Teach My Child to Use a Printable Multiplication Chart?
To teach your child:
- Introduction: Explain what the chart is and how it represents multiplication facts.
- Orientation: Show how rows and columns correspond to numbers being multiplied.
- Patterns: Point out patterns, such as repeated numbers and the commutative property.
- Practice: Encourage regular use by referencing the chart during homework and practice sessions.
- Interactive Activities: Use games and quizzes that involve finding answers on the chart.
- Repetition: Reinforce learning through consistent and repeated use.
- Positive Reinforcement: Praise and reward progress to motivate continued use.
22. Are There Printable Multiplication Charts That Include Division Facts?
Yes, some printable charts combine both multiplication and division facts. These dual-purpose charts:
- Show Inverses: Illustrate the relationship between multiplication and division.
- Enhance Understanding: Help students grasp how division is the inverse operation of multiplication.
- Space-Efficient: Allow for a comprehensive reference without needing separate charts.
- Versatile Learning Tool: Useful for teaching both multiplication and division simultaneously.
These charts are particularly beneficial for reinforcing the connection between the two operations.
23. Can Printable Multiplication Charts Be Used for Online Teaching?
Yes, printable charts can be effectively used in online teaching by:
- Sharing Digitally: Distributing the chart via email, learning platforms, or virtual classrooms.
- Interactive Sessions: Using the chart during live video lessons to explain multiplication concepts.
- Assignments: Assigning chart-based activities and homework for remote learners.
- Virtual Whiteboards: Displaying the chart on virtual whiteboards for real-time interaction.
- Screen Sharing: Teachers can share their screen with the chart during online lessons for demonstration.
Printable charts remain a versatile tool even in digital learning environments.
24. Are There Printable Multiplication Charts That Include Visual Aids?
Yes, some charts incorporate visual aids such as:
- Images and Icons: To represent numbers or multiplication concepts visually.
- Graphs and Patterns: Highlighting mathematical patterns and relationships.
- Themed Illustrations: Engaging themes like animals, space, or characters to make learning more appealing.
- Interactive Elements: Spaces for students to add drawings or notes.
- Color Coding: Differentiating numbers or highlighting specific multiplication patterns.
Visual aids enhance comprehension and make the learning process more engaging for visual learners.
25. How Do Printable Multiplication Charts Compare to Flashcards?
Printable Multiplication Charts:
- Comprehensive: Display all multiplication facts in one place.
- Visual Reference: Serve as a constant visual aid.
- Structured Layout: Organized in a grid format for easy navigation.
Flashcards:
- Portability: Easy to carry and use anywhere.
- Focused Learning: Allow for targeted practice of specific multiplication facts.
- Interactive: Facilitate active recall through flipping and quizzing.
Both tools are effective and can complement each other. Charts provide a broad overview, while flashcards offer targeted practice.
26. Can Printable Multiplication Charts Help with Learning Multiples and Factors?
Yes, they can:
- Identify Multiples: Students can see multiples of numbers by looking across rows and columns.
- Understand Factors: Recognizing which numbers multiply to give a product helps in understanding factors.
- Pattern Recognition: Observing patterns in the chart aids in identifying multiples and factors.
- Problem Solving: Assists in solving problems related to multiples and factors by providing a clear reference.
Using the chart in this way deepens students’ overall number sense and mathematical understanding.
27. Are There Printable Multiplication Charts That Include Times Tables Beyond 12?
Yes, some printable charts extend beyond the 12×12 range to include higher multiplication tables, such as:
- 15×15 or 20×20 Charts: For advanced learners or older students.
- Custom Range Charts: Allowing users to define the range according to their needs.
- Extended Fact Sheets: Providing additional multiplication facts for comprehensive learning.
These extended charts cater to students who are ready to move beyond the basic multiplication tables and tackle more complex multiplication.
28. How Can Parents Use Printable Multiplication Charts to Support Homework?
Parents can support homework by:
- Providing Reference: Keeping the chart accessible for quick look-ups during homework.
- Guiding Practice: Using the chart to practice multiplication facts together.
- Monitoring Progress: Tracking which facts the child has mastered by marking the chart.
- Creating Challenges: Designing homework challenges based on the chart.
- Reinforcing Learning: Discussing patterns and strategies observed in the chart to enhance understanding.
By actively engaging with the chart, parents can reinforce their child’s learning and provide necessary support.
29. Are Printable Multiplication Charts Available in Different Formats (PDF, PNG, etc.)?
Yes, printable multiplication charts are available in various formats to suit different needs, including:
- PDF: Ideal for printing with consistent formatting across devices.
- PNG/JPEG: Useful for digital use, such as embedding in presentations or online resources.
- Word/Excel Files: Allow for easy customization and editing.
- SVG: Scalable vector graphics for high-quality printing at any size.
- Interactive PDFs: Enable interactive elements like clickable links or fillable fields.
Choosing the appropriate format depends on how you intend to use and customize the chart.
30. Can Printable Multiplication Charts Be Integrated into Learning Apps or Platforms?
Yes, printable charts can be integrated into digital learning environments by:
- Uploading to Learning Management Systems (LMS): Making them available for download within platforms like Google Classroom or Moodle.
- Embedding in Educational Apps: Using charts within apps that support image or PDF integration.
- Interactive Elements: Converting printable charts into interactive digital versions for use within apps.
- Resource Sharing: Providing charts as supplementary materials within online courses or tutorials.
Integrating printable charts into digital platforms enhances accessibility and provides versatile learning tools.
31. How Do I Ensure the Printable Multiplication Chart Is Age-Appropriate?
To ensure age-appropriateness:
- Match Educational Standards: Align the chart with the curriculum and learning objectives for the child’s grade level.
- Design Complexity: Choose simpler charts for younger children and more detailed ones for older students.
- Engaging Elements: Incorporate age-appropriate themes and visuals to maintain interest.
- Font Size and Layout: Use larger fonts and clear layouts for younger students, adjusting complexity as needed.
- Supplementary Features: Include age-relevant tips, tricks, and learning aids that resonate with the child’s cognitive level.
Selecting an age-appropriate chart ensures that the learning tool is both effective and engaging for the student.
32. Are There Printable Multiplication Charts That Include Tips and Tricks for Learning?
Yes, some printable charts include additional resources such as:
- Mnemonic Devices: Memory aids to help remember multiplication facts.
- Patterns and Tricks: Highlighting mathematical patterns and shortcuts.
- Step-by-Step Guides: Instructions on how to use the chart effectively.
- Example Problems: Sample problems that utilize the chart for solving.
- Interactive Questions: Questions or challenges that encourage active engagement with the chart.
These features enhance the chart’s educational value by providing strategies to facilitate learning.
33. Can Printable Multiplication Charts Be Used for Group Learning Activities?
Absolutely. They can be used in group settings by:
- Collaborative Games: Organizing group challenges or bingo games based on the chart.
- Peer Teaching: Allowing students to teach each other using the chart as a reference.
- Team Quizzes: Conducting team-based quizzes where groups answer multiplication questions using the chart.
- Interactive Boards: Using large charts on whiteboards for collective problem-solving.
- Station Activities: Setting up different stations with chart-based tasks for group rotations.
Group activities foster collaboration and make learning multiplication more interactive and enjoyable.
34. Are There Printable Multiplication Charts That Include Multiplicative Inverses?
Yes, some charts incorporate multiplicative inverses by displaying both multiplication and division facts. These dual-purpose charts:
- Show Relationships: Illustrate how multiplication and division are inverse operations.
- Facilitate Understanding: Help students understand the connection between the two operations.
- Comprehensive Learning Tool: Provide a broader range of mathematical concepts within one chart.
Including multiplicative inverses enriches the chart’s educational scope, aiding in deeper mathematical comprehension.
35. How Can Printable Multiplication Charts Support Students with Dyscalculia?
Printable charts can support students with dyscalculia by:
- Structured Layouts: Providing clear and organized information to reduce cognitive load.
- Visual Aids: Using colors and patterns to aid memory and recognition.
- Consistency: Offering a consistent reference that helps in building familiarity with multiplication facts.
- Customization: Allowing adjustments in font size, color contrast, and spacing to meet individual needs.
- Supplementary Tools: Combining charts with other supportive materials like manipulatives or interactive activities.
These adaptations make multiplication charts more accessible and supportive for students with learning difficulties in mathematics.
36. Are There Printable Multiplication Charts That Incorporate Technology Integration?
Yes, some charts are designed to integrate with technology by:
- QR Codes: Linking to online resources, tutorials, or interactive quizzes.
- Augmented Reality (AR): Enabling AR features where scanning the chart with a device reveals additional content.
- Digital Enhancements: Including elements that can be interacted with on digital devices, such as clickable areas or embedded videos.
- Hybrid Formats: Combining printable and digital elements for a blended learning experience.
These integrations enhance the traditional chart with modern technological features, making learning more interactive and engaging.
37. Can Printable Multiplication Charts Be Used for Assessment and Tracking Progress?
Yes, they can be used to:
- Track Mastery: Mark off multiplication facts as they are mastered to monitor progress.
- Identify Weak Areas: Highlight which multiplication facts need more practice.
- Set Goals: Establish learning objectives based on chart completion.
- Evaluate Understanding: Use the chart to assess students’ familiarity with multiplication tables.
- Provide Feedback: Offer visual feedback on students’ progress and areas for improvement.
Using charts for assessment helps in systematically tracking and supporting a student’s multiplication learning journey.
38. Are There Printable Multiplication Charts That Include Real-Life Applications?
Yes, some charts incorporate real-life applications by:
- Word Problems: Including real-life scenarios that require multiplication to solve.
- Practical Examples: Demonstrating how multiplication is used in everyday activities like shopping, cooking, or building.
- Visual Representations: Showing multiplication in contexts like arrays, area calculations, and patterns.
- Interactive Elements: Encouraging students to apply multiplication facts to solve practical problems.
Integrating real-life applications makes learning multiplication more relevant and meaningful for students.
39. How Can Printable Multiplication Charts Be Used to Enhance Critical Thinking Skills?
Charts can enhance critical thinking by:
- Pattern Recognition: Encouraging students to identify and analyze mathematical patterns within the chart.
- Problem Solving: Using the chart to solve complex multiplication problems and puzzles.
- Logical Reasoning: Promoting the understanding of the relationships between numbers and operations.
- Comparative Analysis: Comparing different rows and columns to understand multiplication properties.
- Application Tasks: Assigning tasks that require applying multiplication facts to various scenarios.
These activities foster deeper cognitive engagement and enhance critical thinking abilities.
40. Are There Printable Multiplication Charts That Include Historical or Cultural Information?
Yes, some charts incorporate historical or cultural elements by:
- Mathematical History: Including information about the history of multiplication and notable mathematicians.
- Cultural Themes: Featuring designs and elements from different cultures to celebrate diversity.
- Global Multiplication Practices: Highlighting how multiplication is taught and used in various countries.
- Educational Contexts: Providing insights into the development of multiplication concepts over time.
Including historical and cultural information enriches the learning experience and broadens students’ perspectives on mathematics.
41. Can Printable Multiplication Charts Be Used for Homeschooling?
Absolutely. Printable multiplication charts are excellent resources for homeschooling by:
- Structured Learning: Providing a clear framework for teaching multiplication.
- Flexible Use: Allowing for individualized pacing and learning styles.
- Supplementary Material: Serving as a reference tool alongside other homeschooling materials.
- Interactive Learning: Facilitating hands-on activities and interactive lessons.
- Progress Tracking: Helping parents monitor and assess their child’s learning progress.
They are versatile tools that can be easily integrated into various homeschooling curricula and approaches.
42. Are There Printable Multiplication Charts Designed for Visual Learners?
Yes, many charts are specifically designed for visual learners by:
- Color Coding: Using different colors to differentiate numbers, rows, and columns.
- Images and Icons: Incorporating visual elements to represent multiplication concepts.
- Clear Layouts: Providing organized and uncluttered designs for easy comprehension.
- Highlighting Patterns: Visually emphasizing mathematical patterns and relationships.
- Interactive Designs: Including elements that can be colored, labeled, or manipulated visually.
These features cater to visual learners, enhancing their ability to understand and retain multiplication facts.
43. How Can I Incorporate Printable Multiplication Charts into Daily Routines?
Incorporate charts into daily routines by:
- Morning Review: Starting the day with a quick multiplication review using the chart.
- Homework Sessions: Using the chart as a reference during daily homework.
- Meal Time Learning: Discussing multiplication facts during meal preparation or dining.
- Chore Charts: Integrating multiplication tasks into household chores for practical learning.
- Bedtime Practice: Reviewing multiplication facts as part of a nightly routine.
- Scheduled Practice: Setting aside specific times each day for chart-based practice.
Embedding the chart into daily activities makes multiplication practice a consistent and natural part of the child’s routine.
44. Are There Printable Multiplication Charts That Include Technology-Free Learning Activities?
Yes, some charts include or are designed to support technology-free activities such as:
- Puzzles and Games: Printable activities like crosswords, mazes, and matching games based on the chart.
- Worksheet Integration: Combining the chart with practice worksheets for offline learning.
- Craft Projects: Encouraging students to create art or crafts inspired by the multiplication chart.
- Memory Games: Designing flip card games or memory matching games using chart facts.
- Physical Activities: Incorporating movement-based activities like hopscotch with multiplication facts.
These activities promote hands-on and interactive learning without the need for digital devices.
45. Can Printable Multiplication Charts Be Used for Early Childhood Education?
Yes, tailored printable charts can be used in early childhood education by:
- Simplified Layouts: Presenting basic multiplication concepts with smaller number ranges.
- Engaging Designs: Using bright colors and fun themes to capture young children’s attention.
- Interactive Elements: Including areas for coloring, stickers, or simple activities.
- Foundation Building: Introducing the concept of groups and repeated addition as precursors to multiplication.
- Story-Based Learning: Integrating multiplication facts into simple stories or narratives.
These adaptations make multiplication charts accessible and engaging for young learners, laying a strong foundation for future math skills.
46. Are There Printable Multiplication Charts That Include Audio or Kinesthetic Learning Elements?
While printable charts are primarily visual, some can be adapted to include:
- Audio Integration: Adding QR codes or links that lead to audio explanations or songs about multiplication.
- Kinesthetic Activities: Designing charts with interactive components like flaps or movable pieces that students can manipulate.
- Tactile Features: Incorporating textures or raised elements that can be touched and felt.
- Supplementary Materials: Providing accompanying materials that encourage physical interaction, such as counters or blocks.
These adaptations cater to auditory and kinesthetic learners, enhancing the chart’s versatility as a learning tool.
47. How Do I Maintain the Printable Multiplication Chart for Long-Term Use?
To maintain the chart:
- Laminate It: Protects against wear, tears, and spills.
- Use Dry-Erase Markers: For laminated charts, allowing for erasable annotations and repeated use.
- Store Properly: Keep unlaminated charts in a safe, flat place to prevent damage.
- Regular Cleaning: Wipe laminated charts to keep them clean and free from marks.
- Replace When Necessary: Replace worn-out charts to ensure readability and effectiveness.
- Update as Needed: Modify or update the chart to reflect the student’s progress or changing educational needs.
Proper maintenance ensures the chart remains a durable and effective learning resource over time.
48. Can Printable Multiplication Charts Be Combined with Other Educational Tools?
Yes, they can be effectively combined with:
- Flashcards: For targeted practice alongside the comprehensive chart.
- Math Games: Integrating chart-based questions into board games or card games.
- Worksheets: Using the chart as a reference while completing math worksheets.
- Educational Apps: Complementing digital learning tools with the physical chart.
- Manipulatives: Combining with objects like blocks or counters to visualize multiplication concepts.
- Books and Stories: Integrating chart facts into math-related stories or books.
Combining the chart with other tools enhances the learning experience by providing multiple avenues for practice and engagement.
49. Are There Printable Multiplication Charts That Include Fun Facts or Trivia?
Yes, some charts incorporate fun facts or trivia related to multiplication or mathematics in general, such as:
- Historical Facts: Information about the development of multiplication.
- Mathematical Trivia: Interesting tidbits about numbers and multiplication.
- Real-World Applications: Examples of how multiplication is used in various professions and daily life.
- Puzzle Facts: Including math puzzles or brain teasers related to multiplication.
- Inspiring Quotes: Featuring quotes from famous mathematicians or about the importance of math.
These elements make learning more engaging and provide additional context to multiplication facts.
50. How Can I Provide Feedback to My Child Using a Printable Multiplication Chart?
To provide effective feedback:
- Positive Reinforcement: Praise accomplishments and progress on the chart.
- Constructive Feedback: Gently correct mistakes and encourage improvement.
- Visual Indicators: Use stickers, stars, or checkmarks to mark mastered facts.
- Progress Discussions: Regularly discuss the child’s progress and set new goals.
- Encourage Self-Assessment: Allow the child to evaluate their own progress on the chart.
- Celebrate Milestones: Acknowledge when significant portions of the chart are completed.
Providing consistent and supportive feedback helps motivate the child and reinforces their learning journey.