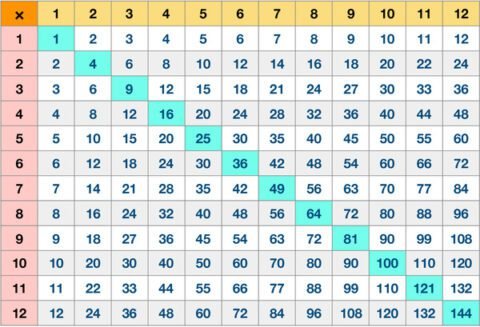
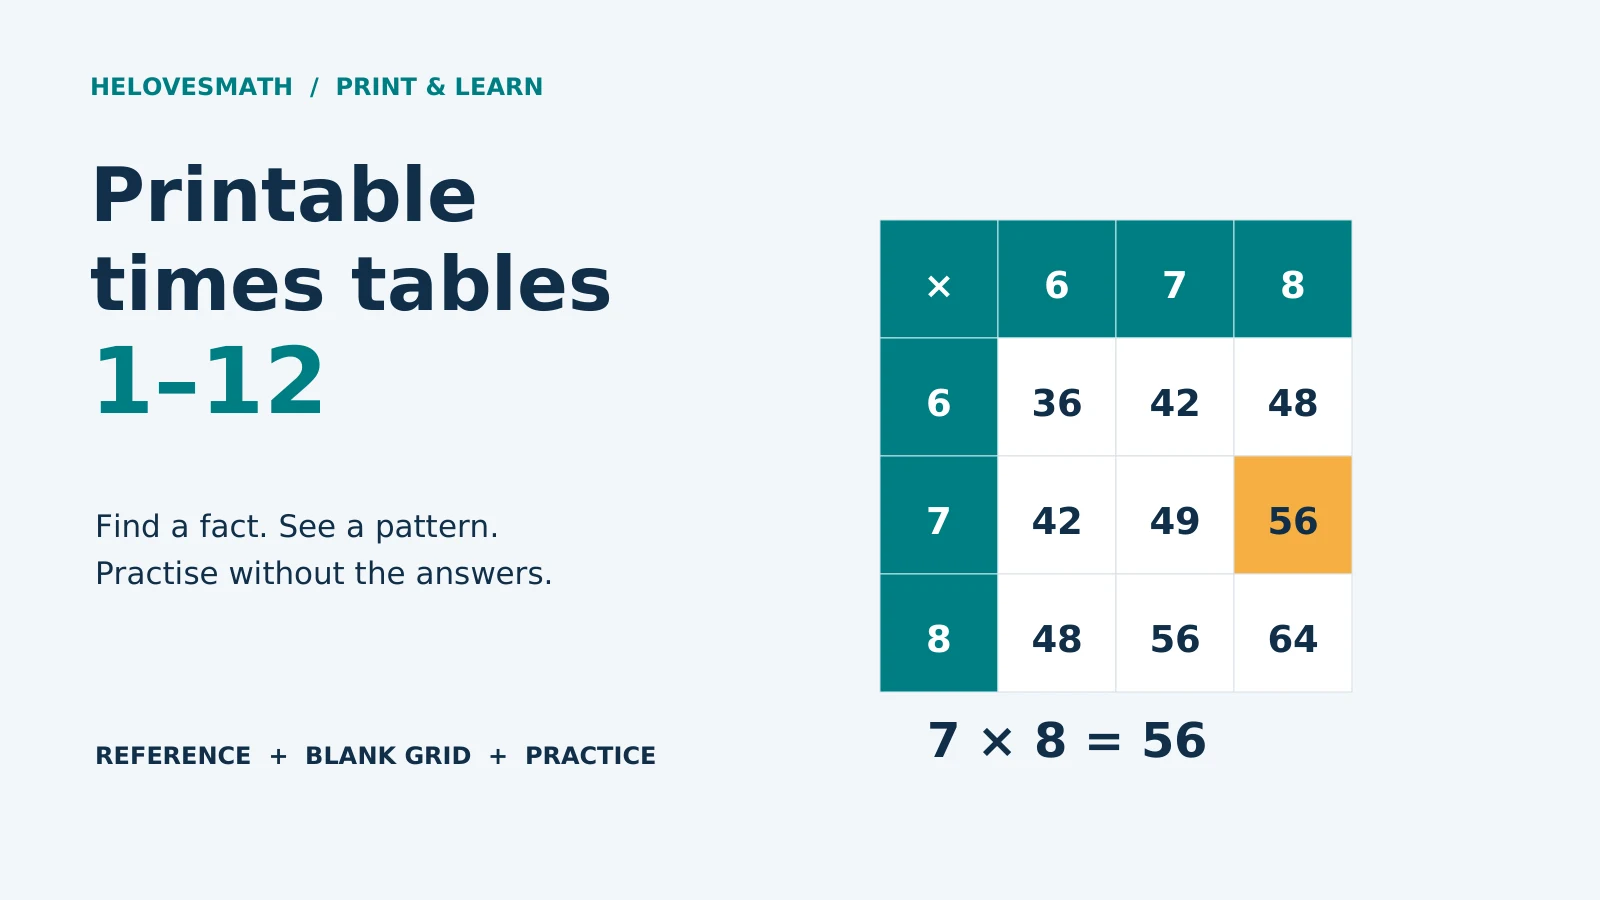
Print a completed times-table chart for reference, a blank grid for practice, or one individual table. Start with the ready-made 1–12 PDF pack, or customise a chart from 1–10, 1–12, 1–15 or 1–20 below.
Free printable times-table PDF pack
Four A4 pages: a completed 1–12 chart, a blank 1–12 grid, six mixed practice questions, and worked answers. The completed chart is also the answer key for the blank grid.
Download the 1–12 printable pack (PDF, 51 KB)
Choose just the pages you need in your print dialog. For US Letter paper, choose “Fit” or “Fit to printable area” and check the preview before printing. No registration required.
Make your own printable chart
Select the format, range and style. The preview updates automatically. Download PDF saves the selected chart; Print now opens a chart-only print dialog.
Format
Range
Style
Choose an individual table
The selected range sets both the available tables and the last multiplier on the sheet.
The chart will appear here when JavaScript is enabled. You can always use the PDF pack above.
On a small screen, swipe the grid sideways. The downloaded PDF includes the whole chart on one page.
Which printable should you choose?
- Completed multiplication grid: use it to look up a fact, check work or compare patterns across tables. The factor headers stay visible while the body contains the products.
- Blank chart: use it for recall or strategy practice. Try a few rows first instead of filling every box. Check with a completed chart of the same range.
- Individual table: focus on one set of facts, such as the 7 times table. Cover the product column for practice, then reveal it to check.
- Times table square: this has the same products as the complete grid, with the diagonal square numbers highlighted. It is useful for spotting symmetry and facts such as 6 × 6 = 36.
Choose 1–10 for a smaller starting grid. Choose 1–12 when studying the 11 and 12 tables. The 1–15 and 1–20 versions are extensions, not a requirement for every primary learner. Larger grids give less writing space, so use a smaller range or larger paper if handwriting becomes cramped.
Curriculum note: England’s Year 4 national curriculum includes recalling multiplication and division facts up to 12 × 12. For learners following US Common Core, Grade 3 includes fluent multiplication and division within 100 and knowing products of two one-digit numbers from memory. These are different targets; follow the learner’s class guidance. A chart beginning at 1 does not cover ×0, so practise zero facts separately.
How to read a times-table chart
- Find the first factor in the left-hand row headings.
- Find the second factor in the top column headings.
- Follow that row and column to their intersection. The number there is the product.
Example: 7 × 8
Find row 7 and column 8. Their meeting cell is 56. Reversing the factors gives the same product: row 8 and column 7 also meet at 56.
The headers are the factors; do not count the header row as a row of products. A 1–10 chart has 100 product cells, while a 1–12 chart has 144. Many cells repeat the same result, so that is not the number of different answers to memorise.
You can also use multiplication facts for division. In row 7, the product 56 sits under column 8, so 56 ÷ 7 = 8. Unlike multiplication, division cannot generally be reversed: 56 ÷ 7 and 7 ÷ 56 are different.
Use patterns to understand and remember facts
- Rows are equal steps. The 6 row goes 6, 12, 18, 24, … because each next product adds another group of 6. The increase is 6, not 1.
- The grid mirrors across its diagonal. For example, 4 × 9 and 9 × 4 are both 36. This is the commutative property of multiplication.
- Double a known fact. If 4 × 7 = 28, then 8 × 7 = 56 because there are twice as many groups of 7.
- Use a nearby easy table. Since 10 × 6 = 60, one fewer group of 6 gives 9 × 6 = 54.
- Look at the diagonal. The products 1, 4, 9, 16, 25, 36, … are square numbers: each multiplies a number by itself.
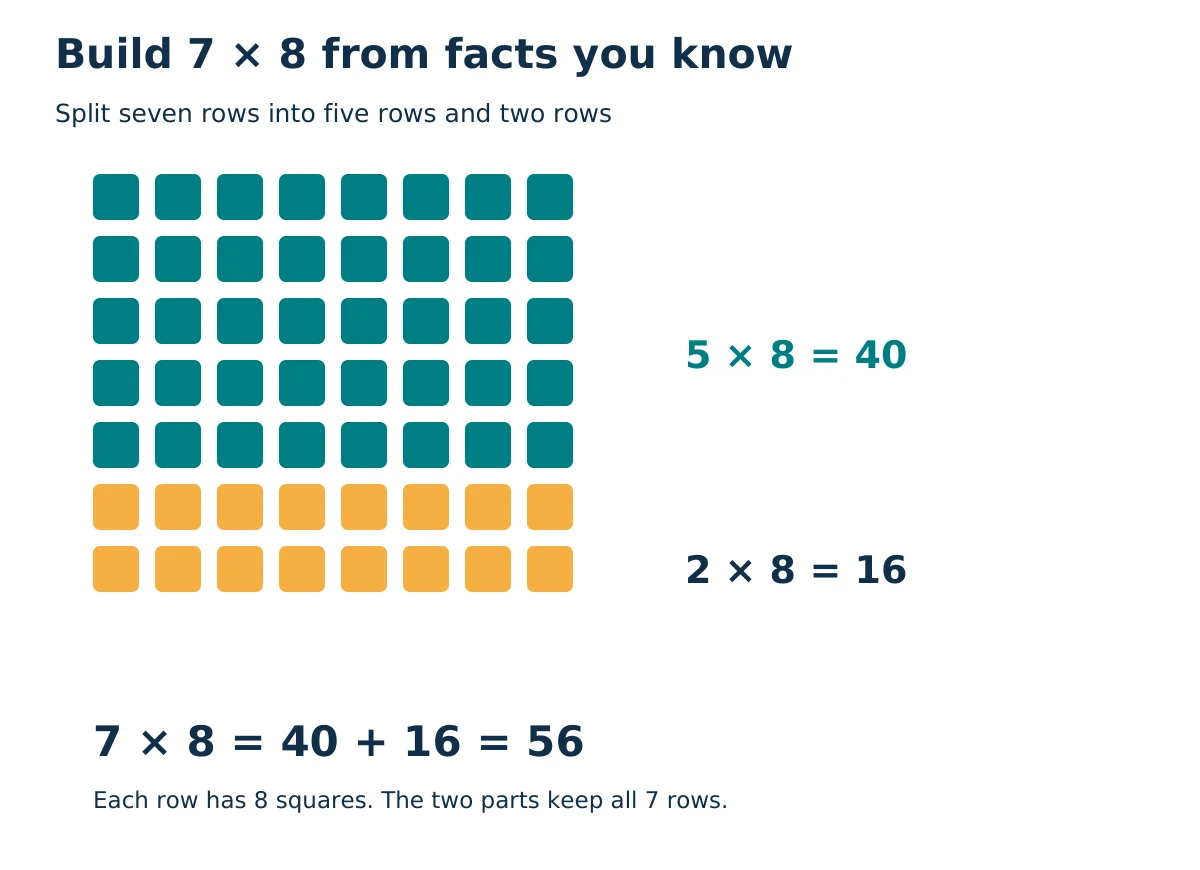
Extend the same idea to 12 × 7:
Split 12 into 10 + 2. Then 12 × 7 = (10 × 7) + (2 × 7) = 70 + 14 = 84.
Say what the numbers mean as you work. In 7 × 8, adding the factors gives 15, but seven groups of eight contain 56 altogether. An array or equal groups can make that distinction visible.
Move from using the chart to recalling facts
A chart is a useful support, but copying from it does not show independent recall. Try this short routine, adjusting the amount of support to the learner:
- Explore: choose a small set of facts and explain them with the chart, objects or an array.
- Cover: hide a few answers. Attempt them from memory or build them from a known fact.
- Check: reveal the answers and explain any correction. Mark facts to revisit rather than repeatedly copying the whole grid.
- Mix: ask the same facts in a different order, away from the chart. Include a missing factor and a related division fact.
- Revisit: return to those facts later. Remove more of the chart only as the learner becomes independent, while keeping agreed learning supports or accommodations.
Start with accuracy and reasoning. A fully completed grid can come from skip-counting, so also ask a few mixed questions. Optional timing may suit a confident learner, but it should not replace explanations or become the only measure of progress.
Six questions to try without the chart
Attempt these before opening the answers. Questions 1–5 stay within 100; question 6 is an extension for the 1–12 chart.
- 6 × 4 = ?
- 8 × 7 = ?
- □ × 9 = 54. What is the missing factor?
- 56 ÷ 7 = ?
- If 10 × 8 = 80, what is 9 × 8?
- 12 × 11 = ?
Show answers and worked strategies
- 24: six groups of four make 24.
- 56: (5 × 8) + (2 × 8) = 40 + 16.
- 6: 6 × 9 = 54.
- 8: 7 × 8 = 56, so 56 ÷ 7 = 8.
- 72: one group of 8 less than 80 gives 80 − 8.
- 132: (12 × 10) + 12 = 120 + 12.
Extra check: 8 × 0 = 0 and 8 × 1 = 8. The ×1 rule keeps the other factor unchanged; the ×0 rule does not.
Printing and classroom tips
- Check the preview: use portrait orientation for the PDFs, choose the correct paper size, and confirm all headings and border cells are visible. Use “Fit” if your printer clips an edge.
- Save ink: select black & white for repeated practice copies. Colour is optional; labels and numbers still convey the information.
- Keep practice manageable: give a learner one row or a few selected cells before a whole blank grid. A teacher can circle the facts to attempt.
- Reuse a copy: a clear sleeve and suitable erasable marker can turn the blank page into reusable practice. Keep a separate reference sheet for checking.
- Use the right print route: the generator’s Print now button prints the chart only. Printing the whole webpage from the browser menu may include the article and site layout.
Frequently asked questions
Are these printable charts free?
Yes. You may print copies for personal learning, classroom teaching and homeschooling without registration. Redistribution, resale or inclusion in commercial products is not permitted without permission.
Does Download PDF save a real PDF?
Yes. The generator creates a one-page PDF for the selected settings. Some browsers open it first; use the PDF viewer’s save or download control. The four-page 1–12 pack is a separate ready-made download above.
Where is the answer key for a blank chart?
Select Multiplication grid with the same range to see all products. For the four-page pack, page 1 is the blank-grid key and page 4 contains the mixed-practice answers.
Which table should a beginner learn first?
Begin with equal groups and arrays, then build from familiar facts such as ×1, ×2, ×5 and ×10. There is no single order that suits every learner. Connect harder facts to ones the learner already understands rather than relying only on repetition.
Why is a 20 × 20 chart smaller on the page?
It fits more rows and columns into the same paper area. Use a smaller range for larger writing spaces, or print on larger paper with an appropriate fit setting. The 1–20 chart is an extension resource.
Continue practising
Explore the interactive multiplication grid, or focus on the 7 times table and 9 times table for further examples and practice.
Sources & References
The curriculum notes and teaching principles above are informed by these primary sources. The charts, illustrations and practice pack on this page are original HeLovesMath resources.