
Frequently Asked Questions (FAQs) about Income Statements, along with detailed answers.
1. What is an Income Statement?
Answer:
An Income Statement, also known as a Profit and Loss Statement (P&L), is a financial document that summarizes a company’s revenues, expenses, and profits or losses over a specific period, typically a quarter or a year. It provides insights into the company’s operational efficiency, profitability, and financial performance, helping stakeholders make informed decisions.
2. What are the main components of an Income Statement?
Answer:
The main components of an Income Statement include:
- Revenue (Sales): Total income generated from the sale of goods or services.
- Cost of Goods Sold (COGS): Direct costs attributable to the production of goods sold or services provided.
- Gross Profit: Revenue minus COGS.
- Operating Expenses: Indirect costs related to running the business, such as salaries, rent, and utilities.
- Operating Income: Gross profit minus operating expenses.
- Other Income and Expenses: Non-operating items like interest, taxes, and one-time gains or losses.
- Net Income: The final profit or loss after all revenues and expenses have been accounted for.
3. How does an Income Statement differ from a Balance Sheet?
Answer:
While both are essential financial statements, they serve different purposes:
Income Statement:
- Purpose: Shows the company’s financial performance over a specific period.
- Components: Revenues, expenses, profits or losses.
- Focus: Measures profitability and operational efficiency.
Balance Sheet:
- Purpose: Provides a snapshot of the company’s financial position at a specific point in time.
- Components: Assets, liabilities, and shareholders’ equity.
- Focus: Measures financial stability and capital structure.
In essence, the Income Statement reflects performance over time, whereas the Balance Sheet shows financial standing at a moment.
4. Why is an Income Statement important?
Answer:
An Income Statement is crucial because it:
- Assesses Profitability: Determines whether a company is making a profit or incurring losses.
- Evaluates Operational Efficiency: Analyzes how effectively a company manages its expenses relative to its revenues.
- Informs Decision-Making: Helps management make strategic decisions based on financial performance.
- Attracts Investors: Provides potential investors with insights into the company’s profitability and growth prospects.
- Facilitates Comparisons: Enables comparison with industry peers and historical performance.
5. What is the difference between gross profit and net income?
Answer:
Gross Profit:
- Definition: Revenue minus Cost of Goods Sold (COGS).
- Focus: Measures the efficiency of production and pricing strategies.
- Calculation: Gross Profit = Revenue−COGS
Net Income:
- Definition: The final profit after all expenses, including operating expenses, interest, taxes, and other items, have been deducted from total revenue.
- Focus: Reflects the overall profitability of the company.
- Calculation: Net Income = Total Revenue − Total Expenses
In summary, gross profit focuses on production efficiency, while net income provides a comprehensive view of overall profitability.
6. How is Revenue recognized on an Income Statement?
Answer:
Revenue recognition is guided by accounting principles that determine when and how revenue is recorded. Under the Revenue Recognition Principle, revenue is recognized when it is earned and realizable, regardless of when cash is received. Key criteria include:
- Delivery or Performance: Goods have been delivered or services have been performed.
- Evidence of an Arrangement: There is a clear agreement between the buyer and seller.
- Fixed or Determinable Price: The amount to be received is fixed or determinable.
- Collectability Assurance: It is probable that the payment will be collected.
Proper revenue recognition ensures that the Income Statement accurately reflects the company’s financial performance.
7. What are Operating Expenses?
Answer:
Operating Expenses are the costs incurred during the normal course of business operations, excluding the Cost of Goods Sold (COGS). They are essential for running the business but are not directly tied to production. Common operating expenses include:
- Selling, General, and Administrative Expenses (SG&A): Salaries, rent, utilities, marketing, and office supplies.
- Depreciation and Amortization: Allocation of the cost of tangible and intangible assets over their useful lives.
- Research and Development (R&D): Costs associated with developing new products or services.
- Interest Expense: Cost of borrowing funds, though sometimes classified separately.
Operating expenses are subtracted from gross profit to determine operating income.
8. What is EBITDA and how is it calculated from the Income Statement?
Answer:
EBITDA stands for Earnings Before Interest, Taxes, Depreciation, and Amortization. It is a measure of a company’s overall financial performance and is used as an alternative to net income. EBITDA provides insights into the company’s operating profitability by excluding non-operational expenses and non-cash charges.
Calculation:
EBITDA = Net Income + Interest + Taxes + Depreciation + Amortization
Alternatively:
EBITDA = Operating Income + Depreciation + Amortization
EBITDA is useful for comparing companies within the same industry, as it removes the effects of financing and accounting decisions.
9. How is Net Income calculated on the Income Statement?
Answer:
Net Income is calculated by subtracting all expenses from total revenues. It represents the company’s profit after all costs have been accounted for.
Formula:
Net Income = Total Revenue − Total Expenses
Steps to Calculate Net Income:
- Start with Total Revenue: Sum of all income generated from sales and other activities.
- Subtract Cost of Goods Sold (COGS): Direct costs associated with producing goods or services.
- Subtract Operating Expenses: Indirect costs like SG&A, R&D, and depreciation.
- Subtract Other Expenses: Including interest, taxes, and any non-operating expenses.
- Add Other Income: Such as investment income or gains from asset sales.
- The Result is Net Income.
Net Income indicates the company’s profitability and is a key metric for investors and analysts.
10. What is the difference between operating income and net income?
Answer:
Operating Income:
- Definition: Also known as Operating Profit or Earnings Before Interest and Taxes (EBIT), it measures the profit from core business operations.
- Calculation: Operating Income=Gross Profit−Operating Expenses\text{Operating Income} = \text{Gross Profit} – \text{Operating Expenses}
- Focus: Reflects the efficiency and profitability of the company’s primary business activities, excluding non-operational factors.
Net Income:
- Definition: The total profit after all revenues and expenses, including operating and non-operating items, have been accounted for.
- Calculation: Net Income = Operating Income + Other Income − Other Expenses − Taxes
- Focus: Provides a comprehensive view of the company’s overall profitability.
In essence, operating income focuses solely on business operations, while net income includes all aspects of the company’s financial activities.
11. What are Non-Operating Expenses?
Answer:
Non-Operating Expenses are costs that are not related to the core business operations. They are incurred from activities that are peripheral or incidental to the main business functions. Common non-operating expenses include:
- Interest Expense: Cost of borrowing funds.
- Losses from Investments: Losses incurred from investment activities.
- Lawsuit Settlements: Payments related to legal disputes.
- Natural Disaster Losses: Costs arising from events like floods or earthquakes.
These expenses are deducted after operating income to determine net income.
12. What is the Purpose of an Income Statement?
Answer:
The primary purposes of an Income Statement are to:
- Assess Profitability: Determine whether the company is making a profit or incurring a loss over a specific period.
- Evaluate Performance: Analyze revenue growth, expense management, and overall financial health.
- Inform Decision-Making: Provide management with data to make strategic business decisions.
- Attract Investors and Creditors: Demonstrate financial performance to potential investors and lenders.
- Compliance and Reporting: Meet regulatory and reporting requirements for stakeholders and authorities.
Overall, the Income Statement is essential for understanding a company’s financial performance and guiding future actions.
13. How often are Income Statements prepared?
Answer:
Income Statements are typically prepared on a periodic basis, including:
- Monthly: For internal management purposes and short-term performance tracking.
- Quarterly: To provide regular updates to stakeholders, including investors and regulatory bodies.
- Annually: As part of the annual financial reporting, often audited for accuracy and compliance.
The frequency depends on the company’s size, regulatory requirements, and management needs.
14. What is the difference between Single-Step and Multi-Step Income Statements?
Answer:
Single-Step Income Statement:
- Structure: Simplistic format where all revenues are grouped together, and all expenses are grouped together.
- Calculation: Net Income is calculated by subtracting total expenses from total revenues in one step.
- Use Case: Suitable for smaller businesses with straightforward financial activities.
Multi-Step Income Statement:
- Structure: More detailed format that separates operating and non-operating activities.
- Calculation: Includes multiple steps to calculate gross profit, operating income, and then net income.
- Use Case: Preferred by larger companies for providing a clearer picture of operational performance.
Key Differences:
- Detail Level: Multi-Step provides more detail, while Single-Step is more consolidated.
- Clarity: Multi-Step offers better insights into different areas of profitability.
- Complexity: Single-Step is simpler and easier to prepare; Multi-Step requires more detailed information.
15. What is Gross Profit and how is it calculated?
Answer:
Gross Profit represents the profit a company makes after deducting the Cost of Goods Sold (COGS) from its total revenue. It measures the efficiency of production and pricing strategies.
Calculation:
Gross Profit = Revenue − COGS
Example: If a company has revenue of $500,000 and COGS of $300,000:
Gross Profit = $500,000 − $300,000 = $200,000
Gross Profit is a key indicator of a company’s ability to produce and sell goods or services profitably.
16. What is the significance of Operating Income?
Answer:
Operating Income measures the profit generated from a company’s core business operations, excluding non-operational activities like investments or financing. It indicates how efficiently a company is managing its operational expenses relative to its gross profit.
Significance:
- Operational Efficiency: Reflects how well the company controls its operating expenses.
- Profitability Assessment: Helps assess the profitability derived from regular business activities.
- Performance Benchmarking: Used to compare operational performance against industry peers.
- Decision-Making: Informs management decisions regarding cost management and operational improvements.
A higher operating income suggests better efficiency and profitability from core operations.
17. How are Depreciation and Amortization treated on the Income Statement?
Answer:
Depreciation and Amortization are non-cash expenses that allocate the cost of tangible and intangible assets over their useful lives.
Depreciation:
- Applies to: Tangible fixed assets like machinery, buildings, and equipment.
- Purpose: Reflects the wear and tear or usage of these assets over time.
Amortization:
- Applies to: Intangible assets like patents, trademarks, and goodwill.
- Purpose: Spreads the cost of these assets over their estimated useful lives.
Treatment on the Income Statement:
Both depreciation and amortization are listed under operating expenses, specifically within the Selling, General, and Administrative Expenses (SG&A) or as separate line items. They reduce the operating income but do not involve actual cash outflows during the period.
Example:
Operating Income=Gross Profit−Operating Expenses (including Depreciation and Amortization)\text{Operating Income} = \text{Gross Profit} – \text{Operating Expenses (including Depreciation and Amortization)}
18. What is the Role of Interest Expense on the Income Statement?
Answer:
Interest Expense represents the cost incurred by a company for borrowed funds. It is the interest payable on any borrowings, such as loans, bonds, or credit lines.
Role:
- Non-Operating Expense: Typically classified under non-operating expenses, as it relates to financing rather than core operations.
- Impact on Net Income: Deducted after operating income to determine net income.
- Indicator of Financial Health: High interest expenses may indicate significant debt levels, which could affect profitability and financial stability.
- Influence on Profitability Ratios: Affects metrics like Interest Coverage Ratio, which assesses a company’s ability to meet its interest obligations.
Example: If a company has an operating income of $100,000 and an interest expense of $10,000:
Net Income = $100,000 − $10,000 − Taxes = $90,000 − Taxes
Interest Expense directly impacts the net profitability of a company.
19. How are Taxes accounted for on the Income Statement?
Answer:
Taxes on the Income Statement represent the income taxes owed to government authorities based on the company’s taxable income.
Accounting Treatment:
- Income Tax Expense: Recorded as a separate line item below operating income and before net income.
- Calculation: Based on the applicable tax rates and the company’s pre-tax income.
- Deferred Taxes: May also be included if there are timing differences between accounting income and taxable income.
Impact:
- Reduces Net Income: Taxes are deducted from pre-tax income to arrive at net income.
- Reflects Tax Obligations: Ensures that the financial statements accurately represent the company’s tax liabilities.
Example:
Interest Expense=$10,000
Pre-Tax Income=$90,000
Income Tax Expense=$27,000 (assuming a 30% tax rate)
Net Income=$63,000
Taxes play a crucial role in determining the final profitability of a company.
20. What is the Purpose of Gross Margin?
Answer:
Gross Margin is a financial metric that indicates the percentage of revenue that exceeds the Cost of Goods Sold (COGS). It measures how efficiently a company is producing and selling its goods or services.
Purpose:
- Assess Production Efficiency: High gross margin suggests effective management of production costs relative to sales.
- Pricing Strategy Evaluation: Helps determine if pricing strategies are effective in covering production costs and generating profit.
- Comparative Analysis: Enables comparison with industry peers to assess relative performance.
- Profitability Insights: Provides an early indicator of profitability before operating expenses are considered.
Calculation:
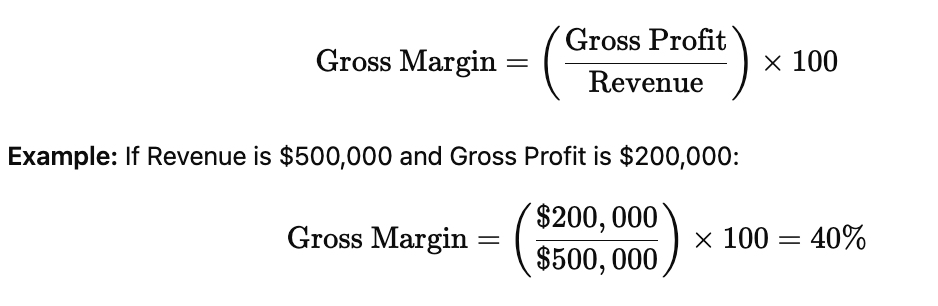
A higher gross margin indicates better efficiency in production and sales.
21. How do Companies Use the Income Statement for Decision-Making?
Answer:
Companies utilize the Income Statement in various ways to guide strategic and operational decisions:
- Performance Evaluation: Assessing profitability and identifying areas needing improvement.
- Budgeting and Forecasting: Creating budgets based on past performance and forecasting future financial outcomes.
- Cost Management: Analyzing expenses to identify opportunities for cost reduction and efficiency gains.
- Pricing Strategies: Adjusting product or service prices based on profitability insights.
- Investment Decisions: Determining the feasibility of new projects or expansions based on financial performance.
- Performance Benchmarking: Comparing performance against industry standards and competitors.
- Dividend Decisions: Deciding on dividend payouts based on net income and retained earnings.
- Risk Management: Identifying financial risks related to expenses, revenue fluctuations, or debt levels.
By leveraging insights from the Income Statement, companies can make informed decisions to enhance financial health and achieve strategic objectives.
22. What is the Relationship Between the Income Statement and Cash Flow Statement?
Answer:
The Income Statement and the Cash Flow Statement are interconnected financial statements that provide different perspectives on a company’s financial performance.
Relationship:
- Net Income Link: The net income from the Income Statement is the starting point for the Cash Flow Statement’s Cash Flow from Operating Activities section.
- Non-Cash Items: Depreciation and amortization from the Income Statement are added back in the Cash Flow Statement, as they are non-cash expenses.
- Accrual Accounting Adjustments: Changes in working capital accounts (like accounts receivable and payable) on the Income Statement affect cash flows.
- Revenue and Expense Recognition: While the Income Statement records revenues and expenses when earned or incurred, the Cash Flow Statement records actual cash inflows and outflows.
Example: A company may report a net income of $100,000 on the Income Statement, but its Cash Flow Statement might show a cash flow from operations of $120,000 due to non-cash expenses and changes in working capital.
Together, these statements provide a comprehensive view of a company’s profitability and cash liquidity.
23. What are the Common Mistakes in Preparing an Income Statement?
Answer:
Common mistakes in preparing an Income Statement include:
- Incorrect Revenue Recognition: Failing to adhere to revenue recognition principles, leading to misstated revenues.
- Omitting Expenses: Not accounting for all relevant expenses, which can inflate net income.
- Misclassifying Expenses: Placing expenses in the wrong categories, affecting the accuracy of gross and operating profits.
- Double-Counting Expenses: Recording the same expense multiple times, distorting total expenses.
- Ignoring Non-Cash Items: Overlooking depreciation, amortization, or impairment losses, affecting net income.
- Incorrect Calculation of COGS: Errors in inventory accounting or expense allocation can misstate gross profit.
- Not Updating for Accruals: Failing to account for accrued revenues or expenses, leading to incomplete financial information.
- Currency Conversion Errors: Mistakes in converting foreign revenues or expenses can impact the accuracy of the Income Statement.
- Inconsistent Reporting Periods: Mixing different reporting periods within the same Income Statement, leading to confusion.
- Lack of Reconciliation: Not reconciling figures with the Balance Sheet or Cash Flow Statement, causing discrepancies.
Avoiding these mistakes ensures the Income Statement accurately reflects the company’s financial performance.
24. How is an Income Statement Used by Investors?
Answer:
Investors use the Income Statement to:
- Assess Profitability: Determine if a company is generating profits and how much.
- Evaluate Growth Trends: Analyze revenue and profit growth over time to assess the company’s expansion.
- Analyze Margins: Examine gross, operating, and net margins to understand cost management and pricing strategies.
- Compare with Peers: Benchmark the company’s financial performance against industry competitors.
- Make Investment Decisions: Use profitability metrics to decide whether to buy, hold, or sell stock.
- Estimate Valuation Ratios: Calculate ratios like Price-to-Earnings (P/E) to value the company’s stock.
- Assess Operational Efficiency: Review operating expenses relative to revenue to gauge efficiency.
- Forecast Future Performance: Use historical Income Statement data to project future earnings and cash flows.
By providing detailed insights into a company’s earnings and expenses, the Income Statement is a vital tool for informed investment decisions.
25. What is the Difference Between Revenue and Net Income?
Answer:
Revenue:
- Definition: The total amount of money generated from sales of goods or services before any expenses are deducted.
- Significance: Indicates the company’s ability to generate sales and attract customers.
Net Income:
- Definition: The final profit after all expenses, including COGS, operating expenses, interest, and taxes, have been subtracted from total revenue.
- Significance: Reflects the company’s overall profitability and financial health.
Key Differences:
- Scope: Revenue is the starting point, while net income is the end result after all costs.
- Insight: Revenue shows sales performance; net income shows profitability.
- Use in Ratios: Revenue is used in metrics like Revenue Growth Rate, while net income is used in ratios like Net Profit Margin.
In summary, revenue measures the ability to generate sales, while net income measures the ability to generate profit.
26. What are the Different Types of Income Statements?
Answer:
Income Statements can be categorized based on their format and purpose:
Single-Step Income Statement:
- Structure: Simplistic format where all revenues and gains are listed first, followed by all expenses and losses.
- Calculation: Net Income is calculated in one step by subtracting total expenses from total revenues.
- Use Case: Suitable for smaller businesses with straightforward financial activities.
Multi-Step Income Statement:
- Structure: Detailed format separating operating and non-operating activities, including sections for gross profit, operating income, and other income/expenses.
- Calculation: Involves multiple steps to calculate gross profit, operating income, and net income.
- Use Case: Preferred by larger companies for providing a clearer picture of operational performance.
Statement of Comprehensive Income:
- Structure: Extends the traditional Income Statement by including other comprehensive income items like foreign currency translation adjustments and unrealized gains/losses.
- Purpose: Provides a more complete view of a company’s financial performance.
- Use Case: Required by some accounting standards for publicly traded companies.
Each type serves different reporting needs, offering varying levels of detail and insight into financial performance.
27. How is Cost of Goods Sold (COGS) Calculated?
Answer:
Cost of Goods Sold (COGS) represents the direct costs attributable to the production of goods sold by a company. It includes the cost of materials and direct labor used to create the product.
Calculation:
COGS = Beginning Inventory + Purchases During the Period − Ending Inventory
Steps:
- Determine Beginning Inventory: The value of inventory at the start of the period.
- Add Purchases: Total cost of inventory purchased or produced during the period.
- Subtract Ending Inventory: The value of inventory remaining at the end of the period.
Example:
Beginning Inventory=$50,000
Purchases=$200,000
Ending Inventory=$30,000
COGS = $50,000 + $200,000 − $30,000 = $220,000
Accurate calculation of COGS is essential for determining gross profit and assessing production efficiency.
28. What is the Purpose of the Income Statement in Financial Analysis?
Answer:
The Income Statement plays a pivotal role in financial analysis by:
- Evaluating Profitability: Assessing the company’s ability to generate profits from operations.
- Analyzing Cost Management: Understanding how effectively the company controls its expenses relative to revenues.
- Assessing Revenue Growth: Tracking changes in revenue over time to gauge business expansion.
- Calculating Financial Ratios: Deriving key ratios like Gross Margin, Operating Margin, and Net Profit Margin for performance evaluation.
- Identifying Trends: Detecting patterns in revenues and expenses that can inform strategic decisions.
- Benchmarking: Comparing financial performance against industry standards and competitors.
- Forecasting: Using historical data to predict future financial performance and inform budgeting.
- Risk Assessment: Identifying areas of financial vulnerability, such as high-interest expenses or declining revenues.
Overall, the Income Statement is fundamental for comprehensive financial analysis, aiding stakeholders in making informed decisions.
29. How are Non-Operating Items Handled in the Income Statement?
Answer:
Non-Operating Items are revenues and expenses that are not related to a company’s core business operations. They are typically reported separately from operating activities to provide a clear view of the company’s primary business performance.
Handling Non-Operating Items:
- Separate Section: Non-operating items are listed below the operating income section.
- Classification: Includes items like interest income/expense, gains or losses from investments, and one-time events like asset sales or restructuring costs.
- Netting: Non-operating revenues and expenses are netted to show a net non-operating figure.
- Disclosure: Detailed disclosures are often provided in the footnotes to explain significant non-operating items.
Example:
Operating Income = $100,000
Interest Expense = −$10,000
Gain on Sale of Assets = $5,000
Net Non-Operating Income= − $10,000 + $5,000 = −$5,000
Net Income = $100,000 − $5,000 = $95,000
Separating non-operating items ensures that stakeholders can distinguish between regular operational performance and incidental financial activities.
30. What is the Role of the Income Statement in Tax Calculation?
Answer:
The Income Statement plays a crucial role in tax calculation by determining the company’s taxable income, which is the basis for income tax liability.
Role in Tax Calculation:
- Determining Pre-Tax Income: The Income Statement calculates the company’s income before taxes by subtracting all expenses from revenues.
- Adjustments for Tax Purposes: Certain expenses may be treated differently for tax purposes, requiring adjustments to reconcile accounting income with taxable income.
- Calculating Income Tax Expense: Based on the pre-tax income and applicable tax rates, the Income Statement records the income tax expense.
- Deferred Taxes: The Income Statement may also account for deferred tax liabilities or assets arising from timing differences between accounting and tax recognition.
Example:
Pre-Tax Income = $100,000
Income Tax Expense (30%) = $30,000
Net Income = $70,000
Accurate tax calculation ensures compliance with tax regulations and reflects the company’s true financial obligations.
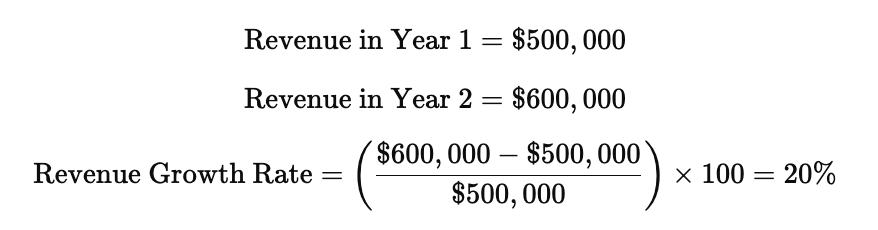
31. How is Revenue Growth Rate Calculated from the Income Statement?
Answer:
Revenue Growth Rate measures the percentage increase in a company’s revenue over a specific period, indicating its ability to expand sales.
Calculation:
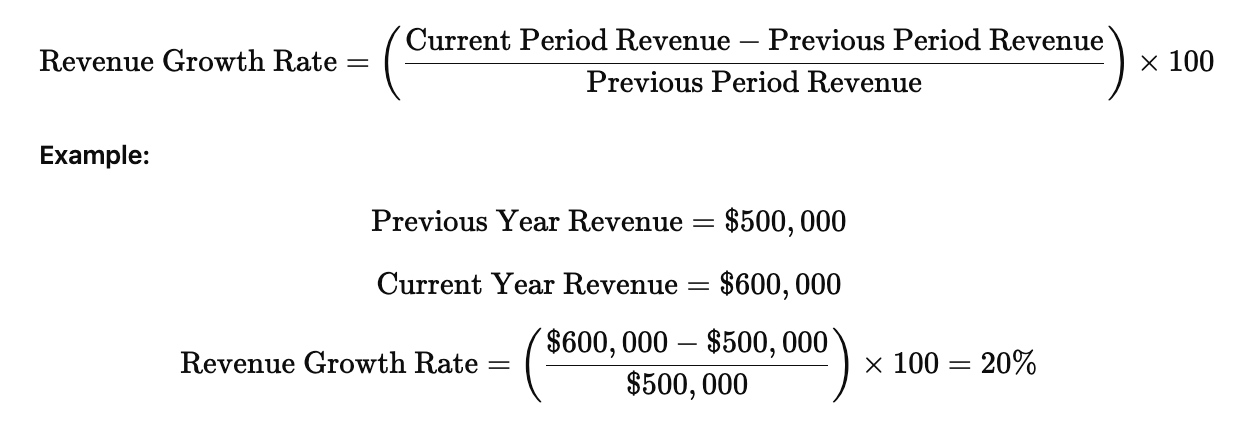
A positive revenue growth rate signifies sales expansion, while a negative rate may indicate declining sales performance.
32. What is Operating Margin and how is it calculated?
Answer:
Operating Margin is a financial metric that indicates the percentage of revenue that remains after covering operating expenses. It measures the efficiency of a company’s core business operations.
Calculation:
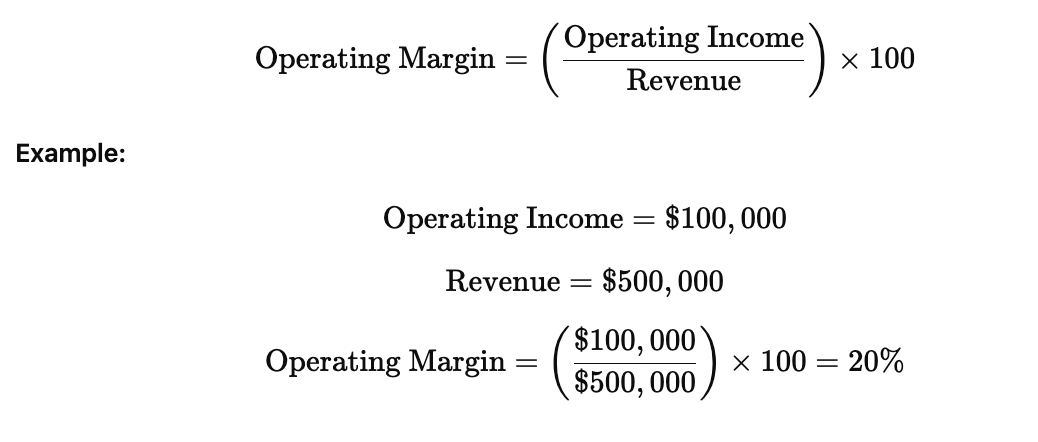
Significance:
- Operational Efficiency: Higher margins indicate better control over operating costs.
- Profitability Indicator: Reflects the company’s ability to generate profit from its operations.
- Benchmarking Tool: Used to compare performance against industry standards and competitors.
Operating Margin helps assess how well a company manages its core business activities relative to its revenue.
33. How is Earnings Per Share (EPS) Derived from the Income Statement?
Answer:
Earnings Per Share (EPS) measures the portion of a company’s profit allocated to each outstanding share of common stock, indicating profitability on a per-share basis.
Calculation:
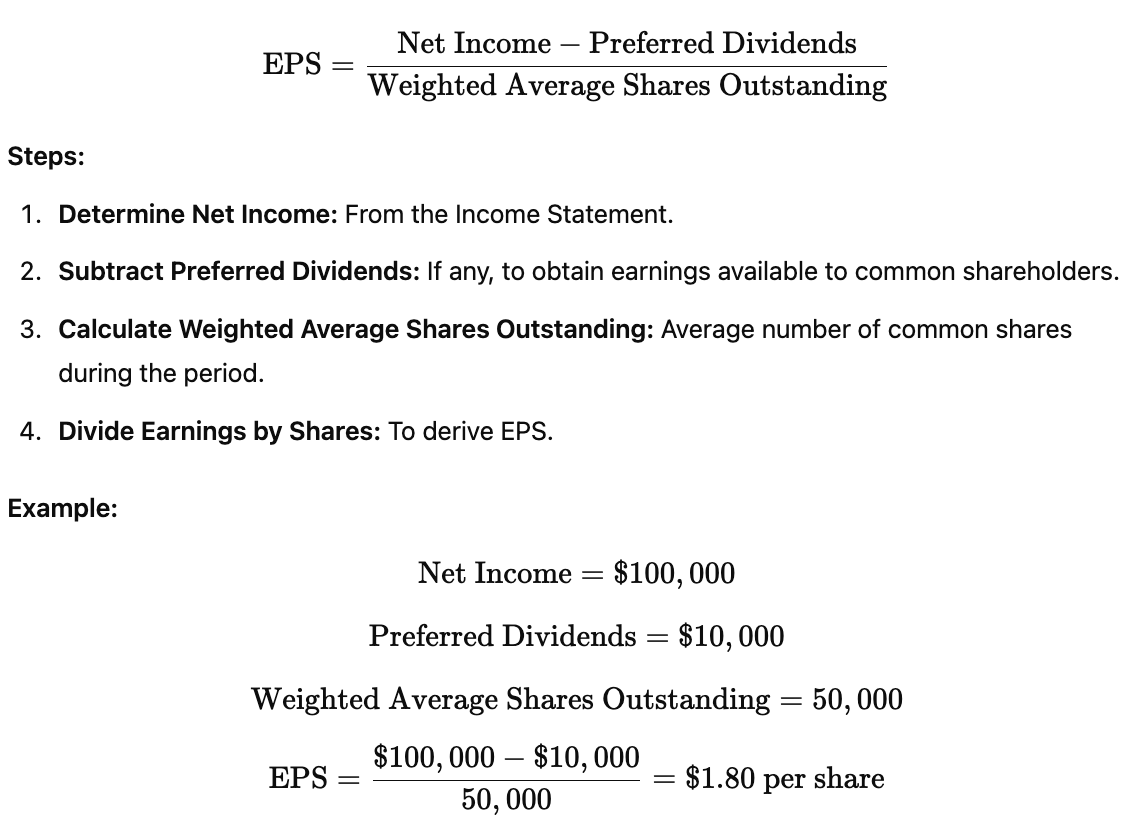
EPS is a key metric for investors to assess profitability and compare companies on a per-share basis.
34. What is the Importance of the Income Statement for Creditors?
Answer:
Creditors use the Income Statement to evaluate a company’s ability to generate sufficient profits to meet its debt obligations. Key aspects include:
- Profitability Assessment: Determines if the company can generate profits to cover interest payments and repay principal.
- Debt Service Coverage Ratio (DSCR): Calculated using net operating income from the Income Statement to assess the ability to service debt.
- Cash Flow Insights: While the Income Statement does not directly show cash flow, profitability can indicate potential cash generation.
- Risk Evaluation: Identifies trends in revenues and expenses that may affect the company’s financial stability and creditworthiness.
- Interest Coverage Ratio: Measures how easily a company can pay interest on outstanding debt using operating income.
By analyzing the Income Statement, creditors assess the financial health and repayment capacity of a company, influencing lending decisions and terms.
35. How do Taxes Affect Net Income on the Income Statement?
Answer:
Taxes directly impact Net Income by reducing the amount of profit a company retains after accounting for all expenses, including tax obligations.
Effects of Taxes:
- Tax Expense Deduction: The Income Statement deducts income tax expense from pre-tax income to arrive at net income.
- Impact on Profitability: Higher tax expenses decrease net income, affecting profitability metrics and shareholder returns.
- Planning and Strategy: Companies may engage in tax planning strategies to minimize tax liabilities, influencing reported net income.
- Deferred Taxes: Timing differences between accounting income and taxable income can create deferred tax assets or liabilities, affecting net income.
Example:
Pre-Tax Income=$100,000
Income Tax Expense=$30,000
Net Income=$70,000
Taxes are a critical factor in determining the final profitability and financial health of a company.
36. What is the Purpose of a Comparative Income Statement?
Answer:
A Comparative Income Statement presents financial performance data for multiple periods side by side. Its primary purposes are to:
- Identify Trends: Track changes in revenues, expenses, and profits over time.
- Evaluate Growth: Assess the company’s growth trajectory in terms of sales and profitability.
- Spot Variances: Highlight significant increases or decreases in specific line items.
- Facilitate Decision-Making: Provide management with insights to make informed strategic decisions.
- Enhance Transparency: Offer a clear view of financial performance across different periods for stakeholders.
- Support Financial Analysis: Enable ratio analysis and other financial metrics to compare performance over time.
Example Structure:
| Income Statement | Year 1 | Year 2 | Year 3 |
|---|---|---|---|
| Revenue | $500,000 | $550,000 | $600,000 |
| COGS | $300,000 | $330,000 | $360,000 |
| Gross Profit | $200,000 | $220,000 | $240,000 |
| Operating Expenses | $100,000 | $110,000 | $120,000 |
| Operating Income | $100,000 | $110,000 | $120,000 |
| Net Income | $70,000 | $80,000 | $90,000 |
Comparative statements provide a dynamic view of financial performance, enhancing analysis and strategic planning.
37. What is Comprehensive Income and How Does It Relate to the Income Statement?
Answer:
Comprehensive Income encompasses all changes in equity during a period except those resulting from transactions with owners (e.g., issuing stock or dividends). It includes both net income from the Income Statement and other comprehensive income items.
Components:
- Net Income: From the Income Statement.
- Other Comprehensive Income (OCI): Includes items such as:
- Foreign currency translation adjustments
- Unrealized gains or losses on available-for-sale securities
- Pension plan gains or losses
- Unrealized gains or losses on derivatives
Relationship to the Income Statement:
- Integrated Reporting: Comprehensive Income provides a more complete picture by adding non-operational and unrealized gains/losses to net income.
- Statement of Comprehensive Income: Often presented as a separate section or a separate statement alongside the Income Statement.
- Equity Impact: Reflects all changes in equity not captured by transactions with shareholders, offering a broader view of financial performance.
Example:
Net Income=$100,000
OCI Items=$20,000
Comprehensive Income=$120,000
Comprehensive Income enhances the understanding of a company’s total financial performance beyond net income.
38. How is the Income Statement Used in Ratio Analysis?
Answer:
The Income Statement provides essential data for various financial ratios used in ratio analysis to evaluate a company’s performance, efficiency, and profitability. Key ratios include:
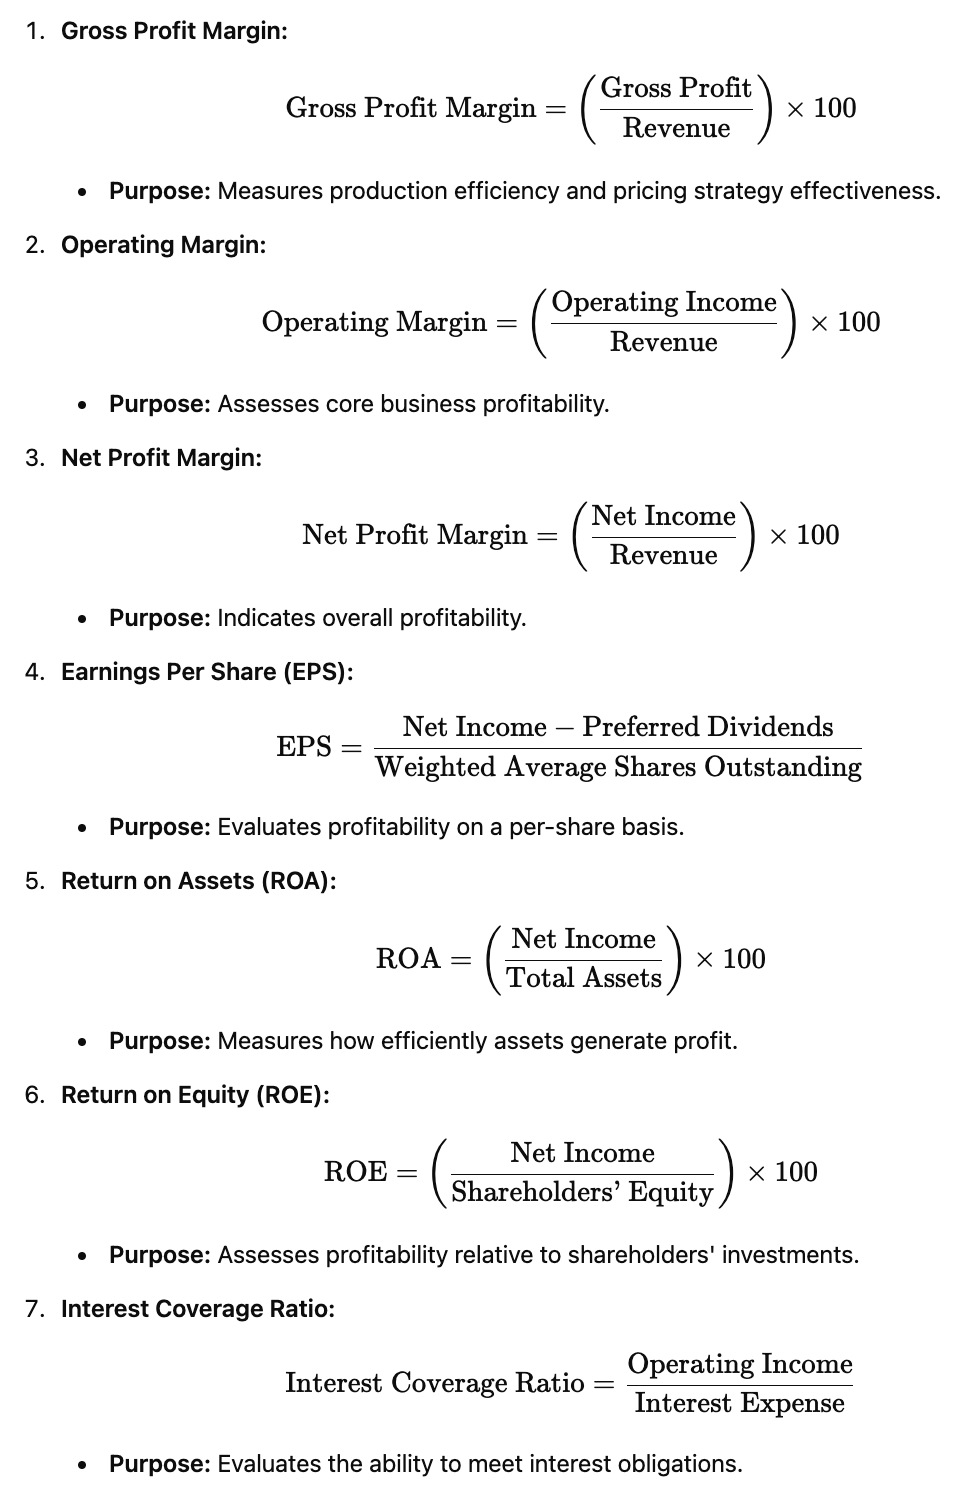
Usage:
- Performance Evaluation: Identify strengths and weaknesses in financial performance.
- Comparative Analysis: Compare with industry standards and competitors.
- Investment Decisions: Guide investors on profitability and growth potential.
- Operational Improvements: Highlight areas needing cost control or efficiency gains.
Ratio analysis leverages Income Statement data to provide nuanced insights into a company’s financial health.
39. What is a Pro Forma Income Statement?
Answer:
A Pro Forma Income Statement is a projected or forecasted financial statement that estimates a company’s future revenues, expenses, and profits. It is based on certain assumptions and scenarios, providing a hypothetical view of financial performance.
Purpose:
- Planning and Forecasting: Assist management in strategic planning and budgeting.
- Investment Proposals: Present potential financial outcomes to investors or lenders.
- Scenario Analysis: Evaluate the impact of different business decisions or market conditions.
- Mergers and Acquisitions: Estimate the financial performance of combined entities.
Components:
- Projected Revenues: Estimated future sales based on growth assumptions.
- Estimated COGS: Forecasted direct costs associated with future sales.
- Projected Operating Expenses: Anticipated indirect costs like salaries and rent.
- Estimated Net Income: Predicted profit after all expenses.
Example Use Case: A company planning to launch a new product line may create a Pro Forma Income Statement to forecast expected revenues, associated costs, and profitability, helping to decide whether to proceed with the investment.
Pro Forma Income Statements are valuable tools for forward-looking financial analysis and decision-making.
40. How is the Income Statement Used for Budgeting?
Answer:
The Income Statement is integral to the budgeting process by providing historical financial data and serving as a foundation for future financial planning.
Usage in Budgeting:
- Historical Analysis: Review past Income Statements to understand revenue trends and expense patterns.
- Revenue Projections: Estimate future sales based on historical growth rates, market conditions, and strategic initiatives.
- Expense Forecasting: Project future operating expenses by analyzing past spending and anticipated changes.
- Profit Targets: Set financial goals for gross profit, operating income, and net income.
- Resource Allocation: Determine how to allocate resources effectively to meet budgetary objectives.
- Variance Analysis: Compare actual performance against budgeted figures to identify discrepancies and adjust strategies.
- Cost Control: Use expense data to implement cost-saving measures and improve efficiency.
- Strategic Planning: Align budgeting with long-term business goals and financial targets.
Example: A company forecasting a 10% revenue increase may adjust its budget to allocate more funds to marketing while controlling production costs to maintain or improve net income.
By leveraging Income Statement data, companies can create realistic and strategic budgets that support financial stability and growth.
41. What is the Impact of One-Time Items on the Income Statement?
Answer:
One-Time Items are non-recurring revenues or expenses that occur infrequently and are not part of the company’s regular business operations. They can significantly impact the Income Statement by:
- Distorting Profitability: One-time gains or losses can inflate or deflate net income, misrepresenting ongoing performance.
- Affecting Comparisons: Including one-time items can complicate year-over-year comparisons and trend analysis.
- Influencing Investor Perception: Significant one-time items may affect investor decisions based on perceived financial performance.
- Requiring Adjustments: Analysts often adjust net income to exclude one-time items for a clearer view of sustainable profitability.
Examples:
- One-Time Gains: Sale of an asset, legal settlements received.
- One-Time Losses: Restructuring costs, natural disaster expenses.
Handling on the Income Statement:
- Separate Line Items: Clearly distinguish one-time items from recurring operations.
- Disclosure Notes: Provide detailed explanations in the footnotes to ensure transparency.
Proper identification and disclosure of one-time items ensure that the Income Statement accurately reflects the company’s ongoing financial performance.
42. What is the Difference Between Revenue and Income?
Answer:
Revenue:
- Definition: The total amount of money generated from sales of goods or services before any expenses are deducted.
- Scope: Represents the top line of the Income Statement.
- Focus: Measures the company’s ability to generate sales and attract customers.
Income:
- Definition: Refers to net income, which is the profit remaining after all expenses, taxes, and costs have been subtracted from total revenue.
- Scope: Represents the bottom line of the Income Statement.
- Focus: Reflects the company’s overall profitability.
Key Differences:
- Position on Income Statement: Revenue is listed first, while income (net income) is the final figure.
- Calculation: Revenue is a starting point; income is the result after all deductions.
- Financial Insight: Revenue indicates sales performance; income indicates profitability.
Understanding the distinction helps in analyzing a company’s financial health and performance.
43. How are Inventory Changes Reflected on the Income Statement?
Answer:
Inventory changes impact the Cost of Goods Sold (COGS), which in turn affects the Income Statement. The relationship is governed by the Inventory Accounting Method, typically FIFO (First-In, First-Out) or LIFO (Last-In, First-Out).
Impact of Inventory Changes:
Increase in Inventory:
- Effect on COGS: Decreases COGS because fewer goods are sold.
- Effect on Gross Profit: Increases gross profit as COGS is lower.
Decrease in Inventory:
- Effect on COGS: Increases COGS because more goods are sold.
- Effect on Gross Profit: Decreases gross profit as COGS is higher.
Calculation:
COGS = Beginning Inventory + Purchases − Ending Inventory
Example:
Beginning Inventory = $50,000
Purchases = $200,000
Ending Inventory = $70,000
COGS = $50,000 + $200,000 − $70,000 = $180,000
An increase in ending inventory ($70,000 vs. $50,000) reduces COGS by $20,000, thereby increasing gross profit.
Proper inventory management is crucial for accurate Income Statement reporting and financial analysis.
44. What is the Significance of Net Income in a Company?
Answer:
Net Income is a fundamental indicator of a company’s financial health and performance. Its significance includes:
- Profitability Measure: Indicates whether the company is profitable after all expenses.
- Earnings Basis for Valuation: Used to calculate key valuation metrics like Earnings Per Share (EPS) and Price-to-Earnings (P/E) ratio.
- Dividend Distribution: Determines the amount available for dividends to shareholders.
- Retention and Reinvestment: Reflects the earnings retained for reinvestment into the business for growth and expansion.
- Performance Benchmarking: Allows comparison of profitability across different periods and against industry peers.
- Financial Health Indicator: Sustained positive net income signifies stable financial health, while consistent losses may signal financial distress.
- Tax Obligations: Represents the taxable income, affecting the company’s tax liabilities.
Overall, net income is a critical metric for stakeholders to assess a company’s ability to generate profit and sustain operations.
45. How Do Non-Cash Expenses Affect the Income Statement?
Answer:
Non-Cash Expenses are costs recorded on the Income Statement that do not involve actual cash outflows during the period. Common non-cash expenses include:
- Depreciation: Allocation of the cost of tangible assets over their useful lives.
- Amortization: Allocation of the cost of intangible assets over their useful lives.
- Impairment Charges: Write-downs of asset values due to impairment.
- Stock-Based Compensation: Costs associated with employee stock options or equity awards.
Effects on the Income Statement:
- Reducing Net Income: Non-cash expenses decrease net income as they are deducted from revenue, affecting profitability metrics.
- Cash Flow Independence: Since these expenses do not involve cash outflows, they do not impact the company’s cash flow directly.
- Accurate Profit Reporting: Including non-cash expenses ensures that the Income Statement accurately reflects the consumption of asset values and the cost of operations.
Example:
Net Income = $100,000 − Depreciation $20,000 = $80,000
While net income is reduced by non-cash expenses, cash flow remains unaffected, highlighting the importance of considering both statements for a complete financial picture.
46. What is Comprehensive Income and How is it Different from Net Income?
Answer:
Comprehensive Income includes all changes in equity during a period except those resulting from transactions with owners, such as issuing stock or paying dividends. It encompasses both Net Income and Other Comprehensive Income (OCI) items.
Components:
- Net Income: From the Income Statement.
- Other Comprehensive Income (OCI): Items not included in net income, such as:
- Foreign currency translation adjustments
- Unrealized gains or losses on available-for-sale securities
- Pension plan gains or losses
- Unrealized gains or losses on derivatives
Difference from Net Income:
- Net Income: Represents the company’s profit after all revenues and expenses, focusing on operational performance.
- Comprehensive Income: Provides a broader view by including OCI, reflecting all changes in equity not captured by net income.
Example:
Net Income = $100,000
OCI Items = $20,000
Comprehensive Income = $120,000
Comprehensive Income offers a more complete picture of a company’s financial performance by including additional equity changes beyond net income.
47. How Does the Income Statement Impact Shareholders’ Equity?
Answer:
The Income Statement impacts Shareholders’ Equity primarily through Retained Earnings. Here’s how:
Net Income Contribution:
- Increase Retained Earnings: Net income adds to retained earnings, enhancing shareholders’ equity.
- Decrease Retained Earnings: Net losses reduce retained earnings, diminishing shareholders’ equity.
Dividends Distribution:
- Reduction in Retained Earnings: When dividends are paid, retained earnings decrease by the dividend amount, even if net income is positive.
Flow:
Income Statement → Net Income → Retained Earnings → Shareholders’ Equity
Example:
Net Income = $100,000
Dividends Paid = $30,000
Increase in Retained Earnings = $100,000 − $30,000 = $70,000
Shareholders’ Equity↑ by $70,000
Thus, the Income Statement directly influences the accumulation or depletion of shareholders’ equity through profits and dividend distributions.
48. What is the Impact of a Loss on the Income Statement?
Answer:
A Loss on the Income Statement occurs when total expenses exceed total revenues during a specific period. Its impact includes:
- Negative Net Income: The company reports a net loss, indicating it did not generate sufficient revenue to cover its expenses.
- Reduced Shareholders’ Equity: Net losses decrease retained earnings, thereby reducing shareholders’ equity.
- Creditworthiness Concerns: Persistent losses can affect the company’s ability to secure financing or may lead to higher borrowing costs.
- Investor Confidence: Net losses may erode investor confidence, potentially affecting stock prices and investment inflows.
- Operational Adjustments: Management may need to implement cost-cutting measures, restructure operations, or revise strategic plans to address the loss.
- Tax Implications: Depending on the jurisdiction, losses can sometimes be carried forward to offset future taxable income, providing tax relief.
Example:
Revenue=$400,000
Total Expenses=$450,000
Net Income=−$50,000 (Net Loss)
A net loss highlights areas requiring attention and corrective action to restore profitability.
49. How is Revenue Growth Evaluated Using the Income Statement?
Answer:
Revenue Growth is evaluated by analyzing the change in a company’s revenue over time, as reported on the Income Statement. It indicates the company’s ability to increase sales and expand its market presence.
Evaluation Steps:
- Compare Periods: Look at revenue figures across multiple periods (e.g., quarterly, annually).
- Calculate Growth Rate: Use the Revenue Growth Rate formula to quantify the increase or decrease.
- Identify Trends: Determine if revenue is consistently growing, declining, or fluctuating.
- Analyze Drivers: Assess factors contributing to revenue changes, such as market expansion, product launches, pricing strategies, or economic conditions.
- Benchmarking: Compare revenue growth with industry averages and competitors to gauge relative performance.
- Assess Sustainability: Evaluate whether the growth is sustainable based on market conditions and the company’s strategic plans.
Example:
A consistent and strong revenue growth rate is generally viewed positively, indicating successful sales and market strategies.
50. What are the Future Trends in Income Statement Reporting?
Answer:
Future trends in Income Statement reporting are influenced by advancements in technology, regulatory changes, and evolving business practices. Key trends include:
Enhanced Transparency and Disclosure:
- Increased emphasis on detailed disclosures for greater clarity and stakeholder trust.
Integration of Environmental, Social, and Governance (ESG) Metrics:
- Incorporating ESG factors into financial reporting to reflect sustainability and ethical practices.
Real-Time Financial Reporting:
- Utilizing cloud computing and automation for up-to-date financial data, enabling timely decision-making.
Use of Artificial Intelligence (AI) and Data Analytics:
- Leveraging AI to analyze Income Statements, detect patterns, and provide predictive insights.
Adaptive Reporting Standards:
- Evolving accounting standards to accommodate new business models, such as digital assets and subscription-based services.
Focus on Non-Financial Performance Indicators:
- Including metrics that capture operational efficiency, customer satisfaction, and employee performance alongside traditional financial data.
Blockchain Technology:
- Enhancing the accuracy and security of financial records through decentralized ledger systems.
Customization and Flexibility:
- Tailoring Income Statements to meet the specific needs of diverse stakeholders, including investors, regulators, and management.
Global Harmonization of Standards:
- Moving towards unified accounting standards across different jurisdictions for better comparability.
Emphasis on Storytelling:
- Combining quantitative data with qualitative narratives to provide a holistic view of financial performance.