Collecting and Summarising Data
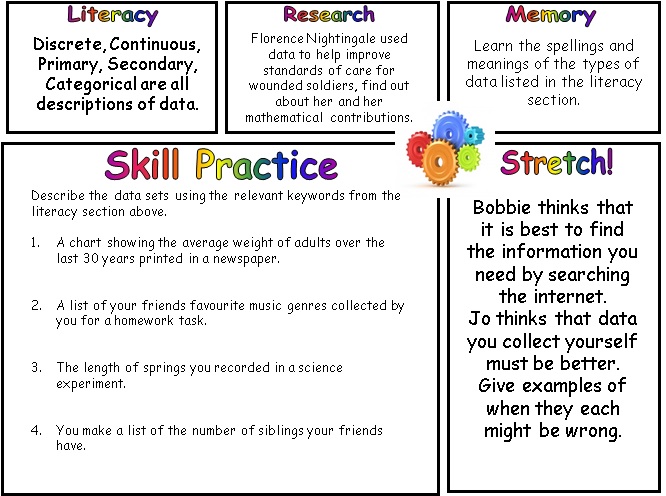 Data Types (@Smarsden53) | 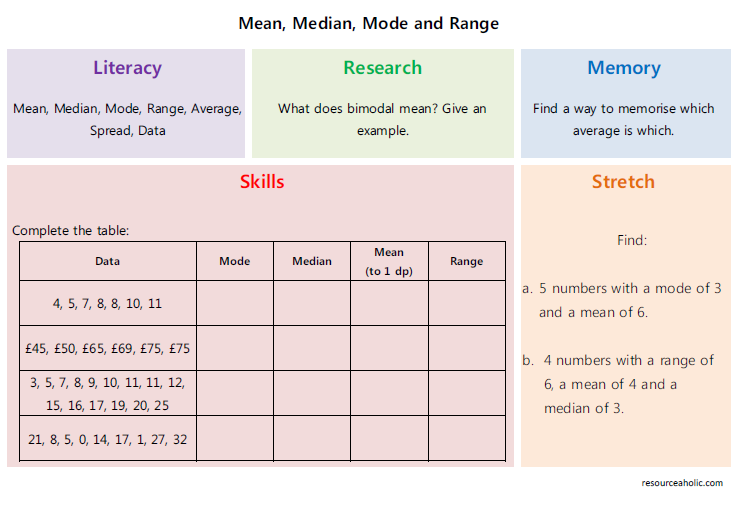 Mean, Median, Mode, Range (@mathsjem) | 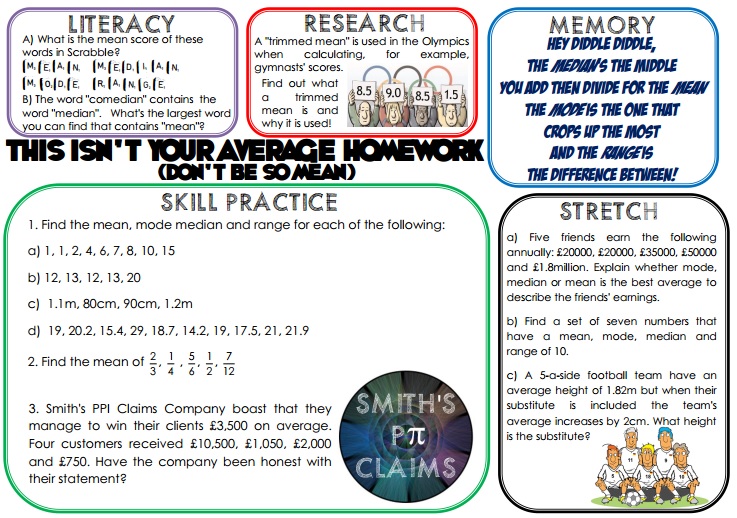 Averages (@aap03102) | 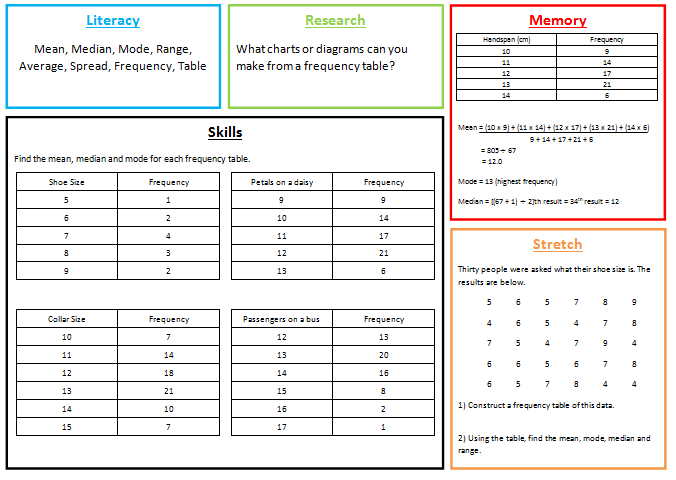 Averages from Frequency Tables (@Stacy_Maths) |
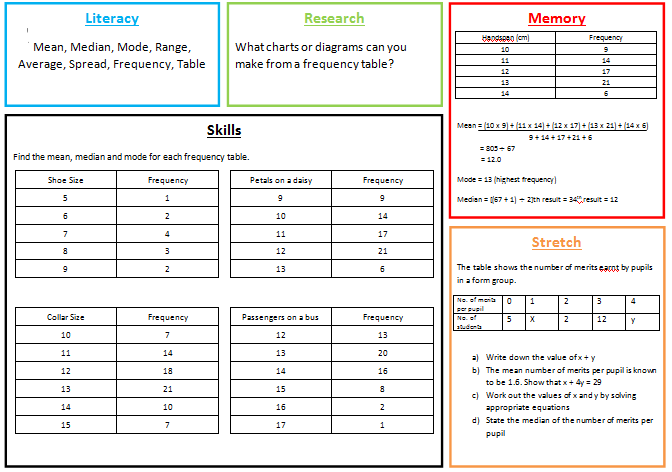 Averages from Frequency Table (R Mahoney, edited from @Stacy_Maths’ orginal) | 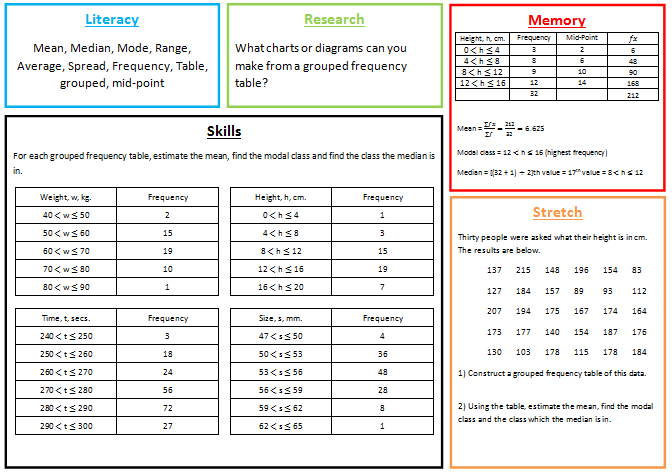 Averages from Grouped Frequency Tables (@Stacy_Maths) | 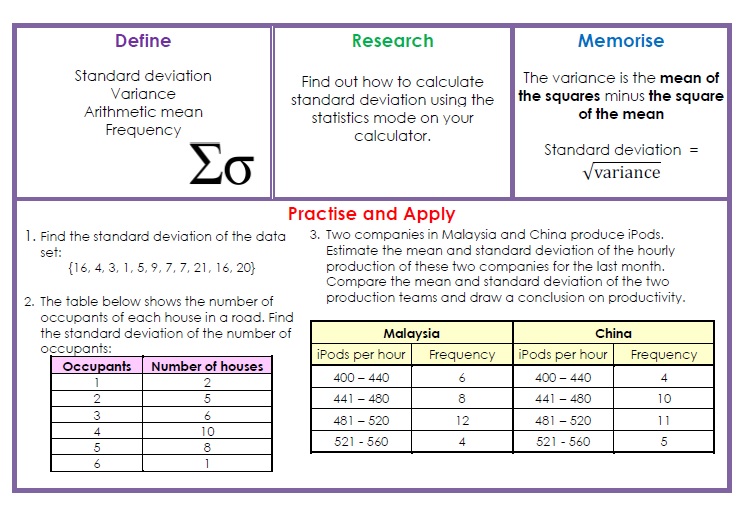 Standard Deviation (@mathsjem) | 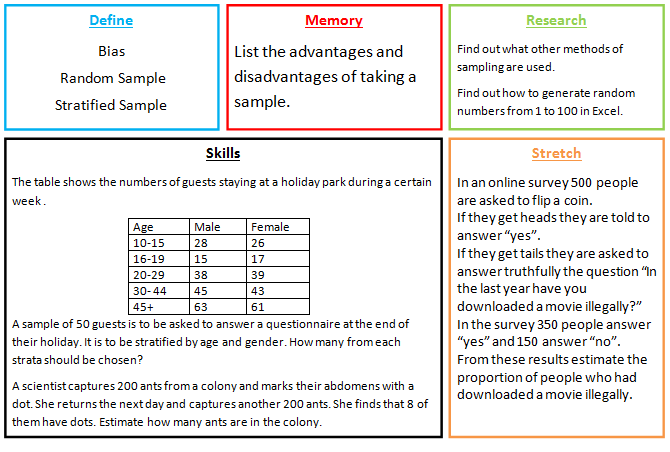 Sampling (Nick Williams) |
Displaying Data
 Frequency Charts (Derek Mooney) | 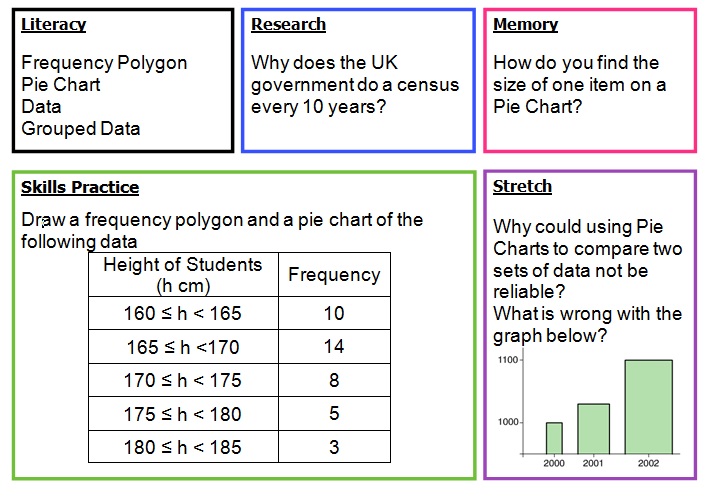 Displaying Data (@marshasmith244) | 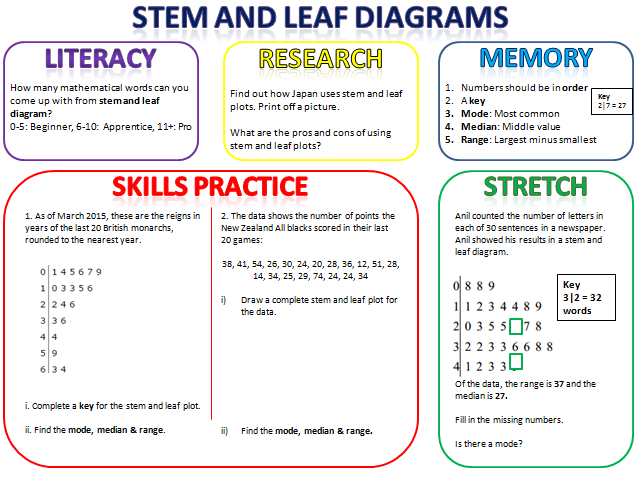 Stem & Leaf (@MrKMorrison) | 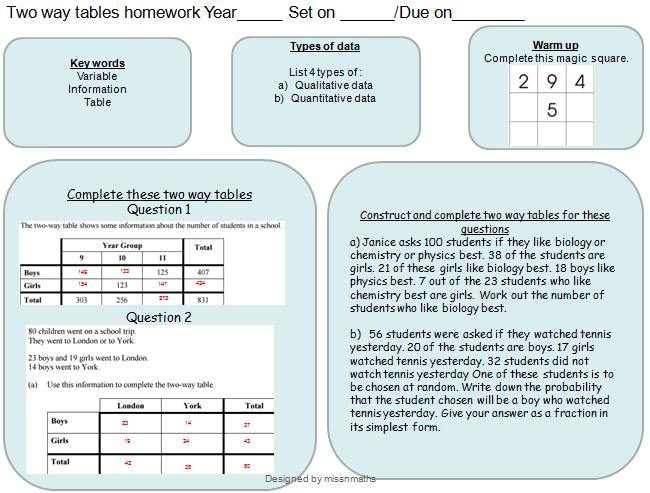 Two-Way Tables (@missnmaths) |
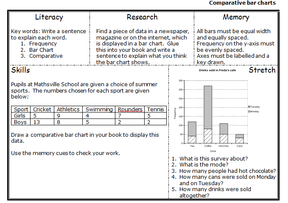 Bar Charts (@mathszest) | 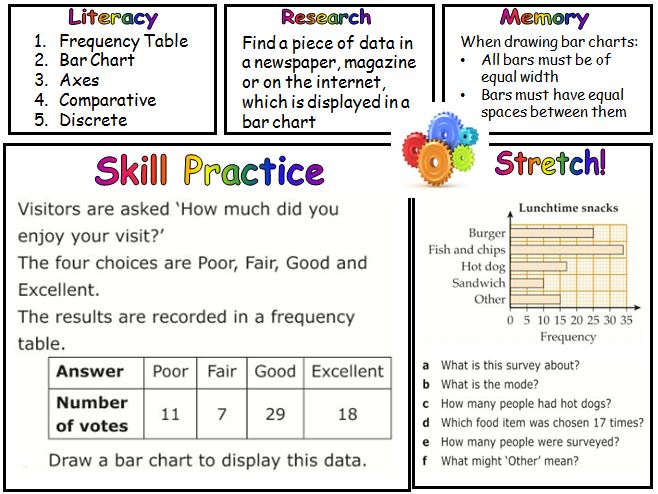 Bar Charts (@Missgourlay) | 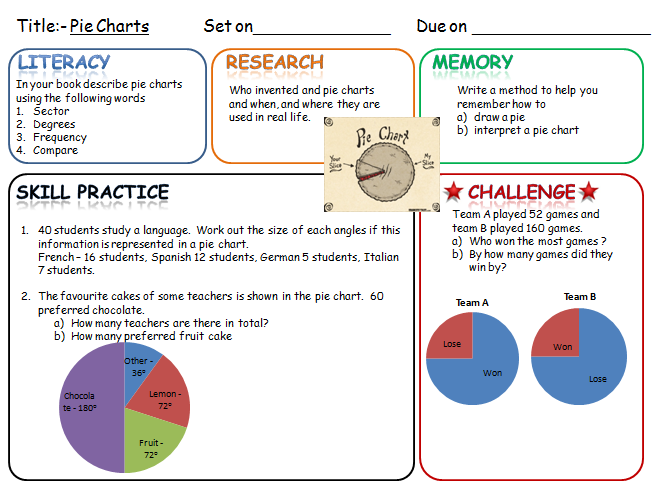 Pie Charts (@pippashley) | 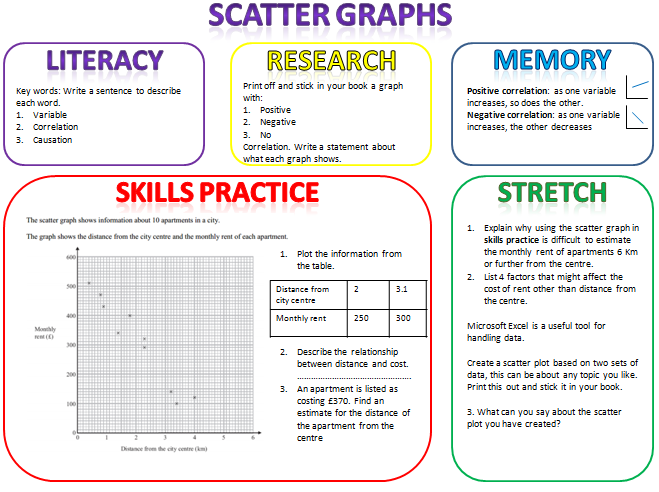 Scatter Graphs @MrKMorrison |
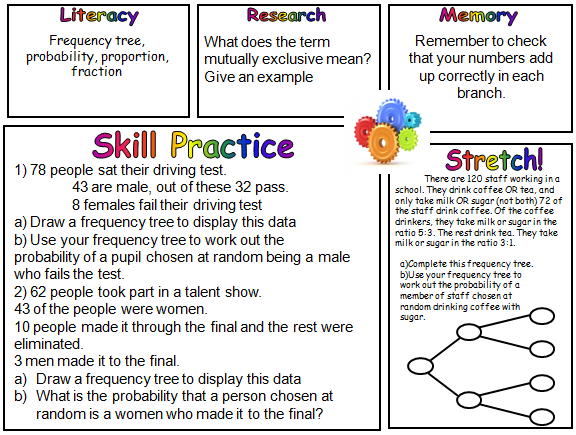 Frequency Trees (Rachel Mahoney) | 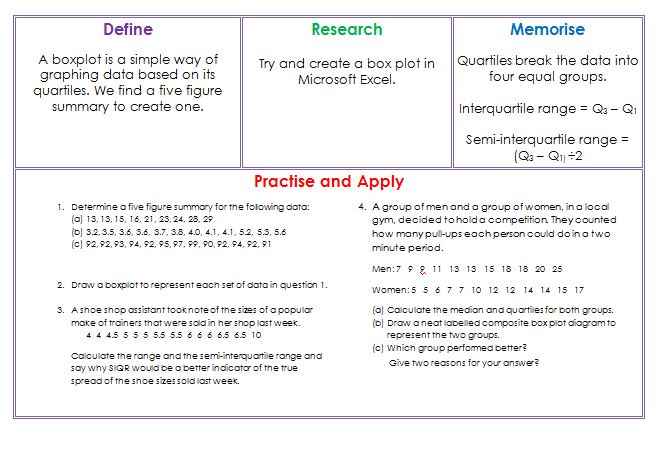 Box and Whisker Plots (@saxsmith27) | 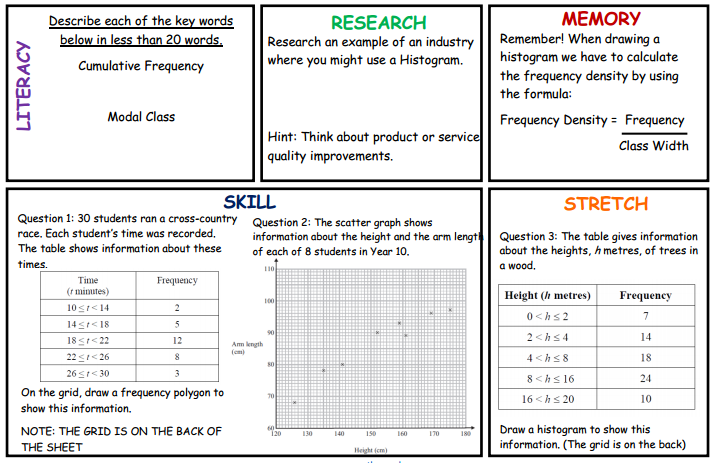 Histograms (@AccessMaths) |
Probability
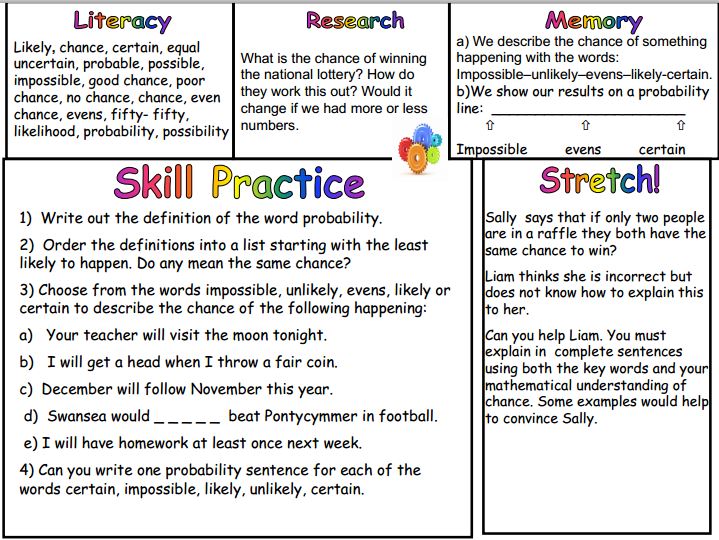 Probability descriptions (@Mzmilburn) | 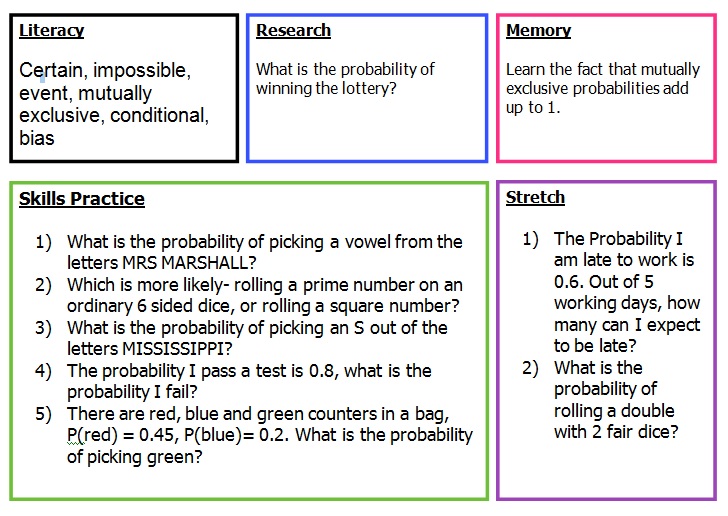 Probability (K Marshall) | 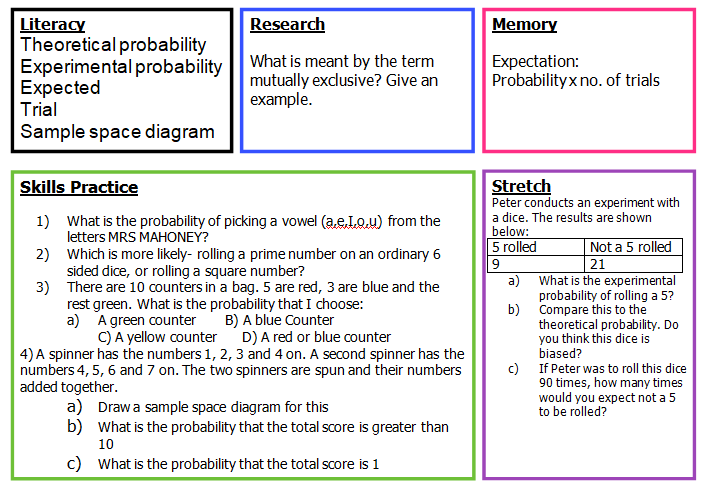 Probability (adapted by Rachel Mahoney) | 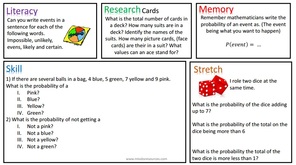 Probability (@MissBsResources) |
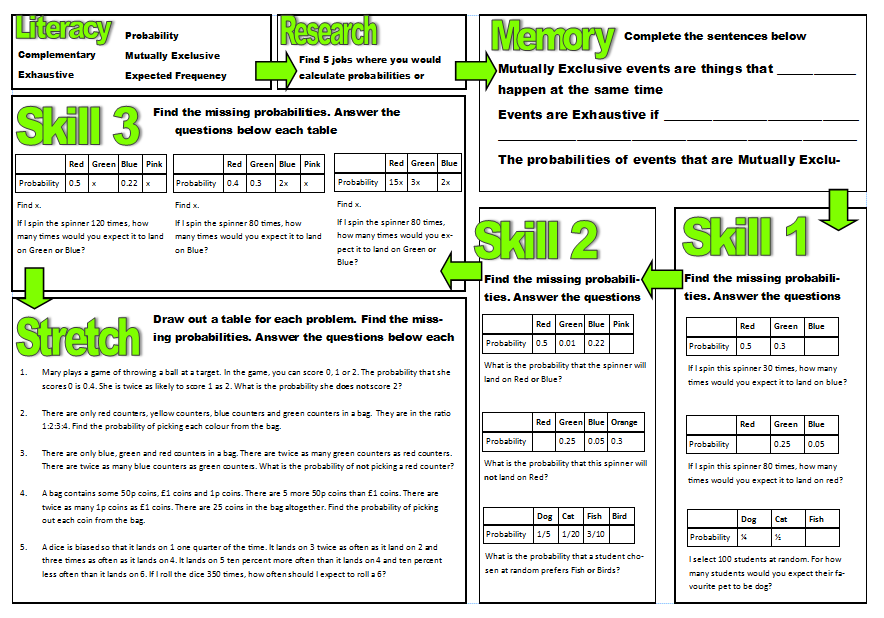 Mutually Exclusive Probabilities (Phil Aldridge) | 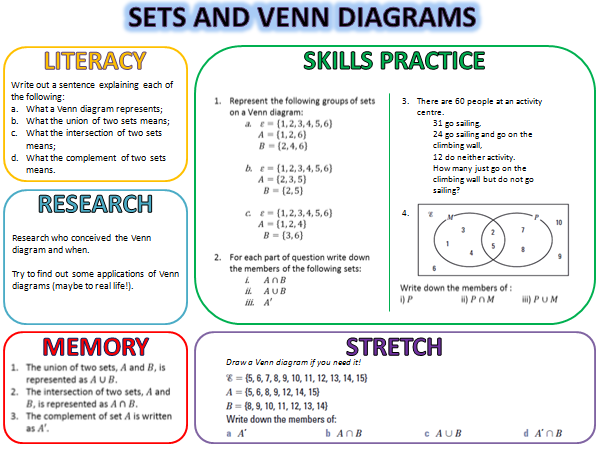 Sets & Venn Diagrams (@RBeckett_Yd) | 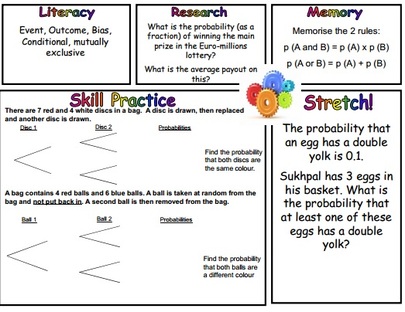 Probability (@MathedUp) |  Probability (Derek Mooney) |
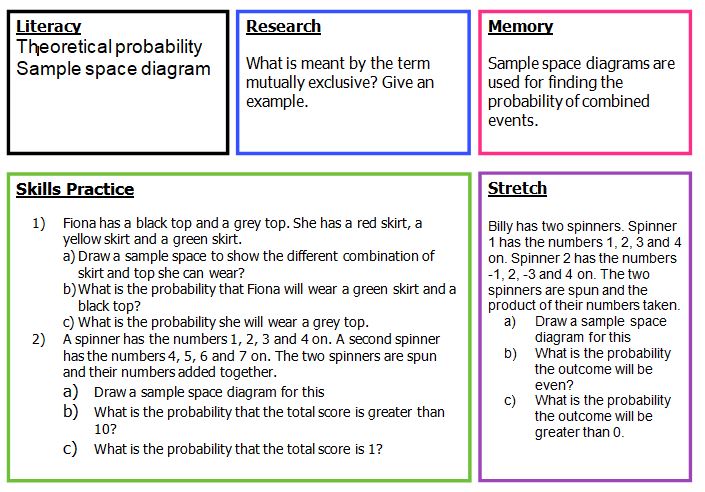 Sample Space Diagrams (Rachel Mahoney) |