Finding the range in math is a fundamental skill that helps you understand the spread or dispersion of a data set. The range is a simple yet powerful concept that indicates the difference between the highest and lowest values in a set of numbers. In this blog post, we will guide you through what the range is, how to calculate it, and why it is important in data analysis. We will also address frequently asked questions about finding the range to ensure you grasp every aspect of this topic.
What is the Range in Math?
In mathematics, the range refers to the difference between the largest and smallest numbers in a data set. It provides insight into how spread out the values are, helping us understand the variability in the data. A large range indicates a significant difference between values, while a small range shows that the values are closer together.
The formula to find the range is:
Step-by-Step Guide to Find the Range
Follow these steps to determine the range of a data set:
Step 1: Identify the Data Set
Gather all the values that make up the data set. This could be a list of test scores, temperatures, prices, or any numerical values that you are analyzing.
Example: Consider the data set: [4, 8, 15, 16, 23, 42]
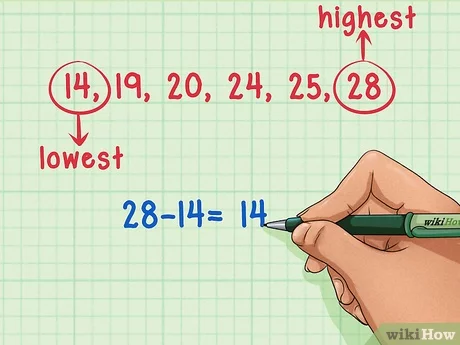
Step 2: Find the Maximum and Minimum Values
Maximum Value: The largest number in the data set.
Minimum Value: The smallest number in the data set.
For the above example:
Maximum value = 42
Minimum value = 4
Step 3: Calculate the Range
Subtract the minimum value from the maximum value to find the range:
The range of the data set is 38.
Why is Finding the Range Important?
The range provides a quick understanding of how much variation exists within a data set. It helps you:
Compare Data Sets: By calculating the range of different data sets, you can quickly compare their variability.
Identify Outliers: A large range might indicate the presence of outliers—values that are significantly different from others in the data set.
Understand Spread: The range helps describe the spread of data, which can be useful in determining how consistent the values are.
Examples of Finding the Range
Example 1: Find the range of the following data set: [12, 5, 9, 3, 15]
Maximum value = 15
Minimum value = 3
Range = 15 – 3 = 12
The range is 12.
Example 2: Find the range of test scores: [90, 85, 78, 88, 95, 100]
Maximum value = 100
Minimum value = 78
Range = 100 – 78 = 22
The range is 22.
Limitations of Using the Range
While the range is a useful measure, it has some limitations:
Sensitive to Outliers: The range can be greatly affected by extreme values. If a data set has outliers, the range may not accurately represent the general spread of the data.
Does Not Show Distribution: The range only gives information about the difference between the largest and smallest values, without revealing how the data is distributed between those points.
Frequently Asked Questions about Finding the Range
Q1: What is the formula for finding the range in math?
The formula to find the range is:
Simply subtract the smallest value from the largest value in the data set.
Q2: What does the range tell us about a data set?
The range tells us how spread out the values in a data set are. A larger range means there is a greater difference between the highest and lowest values, indicating more variability.
Q3: Can the range be negative?
No, the range cannot be negative. Since it is the difference between the maximum and minimum values, it will always be zero or positive.
Q4: What are the limitations of using the range?
The range is sensitive to outliers and does not provide information about the distribution of values within the data set. It is a simple measure of spread, but it does not give a complete picture of the data.
Q5: How is the range different from other measures of spread, like variance or standard deviation?
The range only considers the extremes of the data set (maximum and minimum), while variance and standard deviation take into account all data points, providing a more comprehensive measure of variability.
Q6: Can I find the range for non-numerical data?
No, the range is a measure used for numerical data. It requires a maximum and minimum value, which is not applicable to categorical data.
Q7: How do I find the range if the data set includes negative numbers?
The process for finding the range is the same, even if the data set includes negative numbers. Identify the maximum and minimum values, then subtract the minimum from the maximum.
Q8: Is the range affected by adding more values to the data set?
Yes, adding values can change the maximum or minimum, which in turn may change the range. However, if the new values are within the current range, the range will remain unchanged.
Q9: What is the range if all the values in the data set are the same?
If all values in the data set are the same, the range will be zero because the maximum and minimum values are equal.
Q10: How is the range useful in real-life situations?
The range is useful in various fields such as finance, weather forecasting, and quality control to understand the variability in data, such as stock price changes, temperature fluctuations, or product measurements.
Conclusion
Finding the range in math is a straightforward process that can provide valuable insights into the spread of a data set. By understanding the range, you can quickly gauge the variability and compare different data sets effectively. While it has limitations, the range is still a useful tool for basic data analysis. Remember, it’s essential to consider other measures like mean, median, and standard deviation for a more complete understanding of your data.